GNC 2010 Annual Report Download - page 55
Download and view the complete annual report
Please find page 55 of the 2010 GNC annual report below. You can navigate through the pages in the report by either clicking on the pages listed below, or by using the keyword search tool below to find specific information within the annual report.-
 1
1 -
2
-
3
-
4
-
5
-
6
-
7
-
8
-
9
-
10
-
11
-
12
-
13
-
14
-
15
-
16
-
17
-
18
-
19
-
20
-
21
-
22
-
23
-
24
-
25
-
26
-
27
-
28
-
29
-
30
-
31
-
32
-
33
-
34
-
35
-
36
-
37
-
38
-
39
-
40
-
41
-
42
-
43
-
44
-
 45
45 -
 46
46 -
 47
47 -
 48
48 -
 49
49 -
 50
50 -
 51
51 -
 52
52 -
 53
53 -
 54
54 -
 55
55 -
 56
56 -
 57
57 -
 58
58 -
 59
59 -
 60
60 -
 61
61 -
 62
62 -
 63
63 -
 64
64 -
 65
65 -
66
-
67
-
68
-
69
-
70
-
71
-
72
-
73
-
74
-
75
-
76
-
77
-
78
-
79
-
80
-
81
-
82
-
83
-
84
-
85
-
86
-
87
-
88
-
89
-
90
-
91
-
92
-
93
-
94
-
95
-
96
-
97
-
98
-
99
-
100
-
101
-
102
-
103
-
104
-
105
-
106
-
107
-
108
-
109
-
110
-
111
-
112
-
113
-
114
-
115
-
116
-
117
-
118
-
119
-
120
-
121
-
122
-
123
-
124
-
125
-
126
-
127
-
128
-
129
-
130
-
131
-
132
-
133
-
134
-
135
-
136
-
137
-
138
-
139
-
140
-
141
-
142
-
143
-
144
-
145
-
146
-
147
-
148
-
149
-
150
-
151
-
152
-
153
-
154
-
155
-
156
-
157
-
158
-
159
-
160
-
161
-
162
-
163
-
164
-
165
-
166
-
167
-
168
-
169
-
170
-
171
-
172
-
173
-
174
-
175
-
176
-
177
-
178
-
179
-
180
-
181
-
182
-
183
-
184
-
185
-
186
-
187
-
188
-
189
-
190
-
191
-
192
-
193
-
194
-
195
-
196
-
197
-
198
-
199
-
200
-
201
-
202
-
203
-
204
-
205
-
206
-
207
-
208
-
209
-
210
-
211
-
212
-
213
-
214
-
215
-
216
-
217
-
218
-
219
-
220
-
221
-
222
-
223
-
224
-
225
-
226
-
227
-
228
-
229
-
230
-
231
-
232
-
233
-
234
-
235
-
236
-
237
-
238
-
239
-
240
 |
 |

Table of Contents
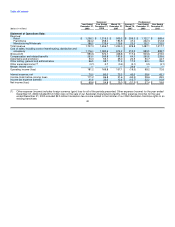
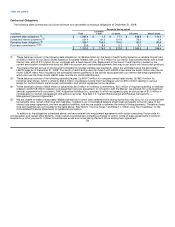
Product costs. Product costs increased $29.5 million, or 3.6%, to $840.0 million for the year ended December 31, 2009 compared to
$810.5 million for the same period in 2008 as a result of increased sales volumes and raw materials costs. Consolidated product costs, as a
percentage of net revenue, were 49.2% for the year ended December 31, 2009 as compared to 48.9% for the year ended December 31, 2008.
Warehousing and distribution costs. Warehousing and distribution costs increased $0.1 million, or 0.2%, to $57.6 million for the year
ended December 31, 2009 compared to $57.5 million for the same period in 2008. The increase was primarily due to increased internet
fulfillment wages offset by decreases in fuel costs. Consolidated warehousing and distribution costs, as a percentage of net revenue, were
3.4% and 3.5% for the year ended December 31, 2009 and 2008, respectively.
Occupancy costs. Occupancy costs increased $4.2 million, or 2.0%, to $218.8 million for the year ended December 31, 2009 compared
to $214.6 million for the same period in 2008. This increase was the result of increases in depreciation expense of $2.9 million and lease
related costs of $1.4 million, offset by $0.1 million decrease in other costs. Consolidated occupancy costs, as a percentage of net revenue,
were 12.8% and 13.0% for the year ended December 31, 2009 and 2008, respectively.
Selling, General and Administrative ("SG&A") Expenses
Our consolidated SG&A expenses, including compensation and related benefits, advertising and promotion expense, other selling,
general and administrative expenses, and amortization expense, increased $5.9 million, or 1.5%, to $409.5 million, for the year ended
December 31, 2009 compared to $403.6 million for the same period in 2008. These expenses, as a percentage of net revenue, were 24.0% for
the year ended December 31, 2009 compared to 24.4% for the year ended December 31, 2008.
Compensation and related benefits. Compensation and related benefits increased $13.2 million, or 5.3%, to $263.0 million for the year
ended December 31, 2009 compared to $249.8 million for the same period in 2008. The increase was due to: (1) $8.5 million in base wages to
support our increased store base and sales volume and to comply with the increases in minimum wage rates; (2) $1.4 million in health
insurance; (3) $1.2 million in commissions and incentive expense; and (4) other wage related expenditures of $1.0 million. In addition, 2008
expenses included a $1.1 million reduction in base wages due to a change in our vacation policy effective March 31, 2008.
Advertising and promotion. Advertising and promotion expenses decreased $5.1 million, or 9.1%, to $50.0 million for the year ended
December 31, 2009 compared to $55.1 million during the same period in 2008. Advertising expense decreased primarily as a result of
decreases in media costs of $2.3 million and print advertising costs of $3.4 million, partially offset by increases in other advertising costs of
$0.6 million.
Other SG&A. Other SG&A expenses, including amortization expense, decreased $2.2 million or 2.3%, to $96.5 million for the year ended
December 31, 2009 compared to $98.7 million for the year ended December 31, 2008. Decreases in bad debt expense of $2.3 million,
amortization expense of $1.2 million and other selling expenses of $0.3 million were partially offset by increases in telecommunications
expenses of $1.9 million due to the installation of a new point of sale ("POS") register system in 2008 and professional fees of $0.8 million. In
addition, 2009 other SG&A includes a $1.1 million gain from proceeds received from the Visa/Mastercard antitrust litigation settlement.
Foreign Currency (Loss) Gain
Foreign currency loss/gain for the year ended December 31, 2009 and 2008, resulted primarily from accounts payable activity with our
Canadian subsidiary. We recognized income of $0.1 million for the year ended December 31, 2009 and a loss of $0.7 million for the year ended
December 31, 2008. 49