GNC 2010 Annual Report Download - page 48
Download and view the complete annual report
Please find page 48 of the 2010 GNC annual report below. You can navigate through the pages in the report by either clicking on the pages listed below, or by using the keyword search tool below to find specific information within the annual report.-
 1
1 -
2
-
3
-
4
-
5
-
6
-
7
-
8
-
9
-
10
-
11
-
12
-
13
-
14
-
15
-
16
-
17
-
18
-
19
-
20
-
21
-
22
-
23
-
24
-
25
-
26
-
27
-
28
-
29
-
30
-
31
-
32
-
33
-
34
-
35
-
36
-
37
-
 38
38 -
 39
39 -
 40
40 -
 41
41 -
 42
42 -
 43
43 -
 44
44 -
 45
45 -
 46
46 -
 47
47 -
 48
48 -
 49
49 -
 50
50 -
 51
51 -
 52
52 -
 53
53 -
 54
54 -
 55
55 -
 56
56 -
 57
57 -
 58
58 -
59
-
60
-
61
-
62
-
63
-
64
-
65
-
66
-
67
-
68
-
69
-
70
-
71
-
72
-
73
-
74
-
75
-
76
-
77
-
78
-
79
-
80
-
81
-
82
-
83
-
84
-
85
-
86
-
87
-
88
-
89
-
90
-
91
-
92
-
93
-
94
-
95
-
96
-
97
-
98
-
99
-
100
-
101
-
102
-
103
-
104
-
105
-
106
-
107
-
108
-
109
-
110
-
111
-
112
-
113
-
114
-
115
-
116
-
117
-
118
-
119
-
120
-
121
-
122
-
123
-
124
-
125
-
126
-
127
-
128
-
129
-
130
-
131
-
132
-
133
-
134
-
135
-
136
-
137
-
138
-
139
-
140
-
141
-
142
-
143
-
144
-
145
-
146
-
147
-
148
-
149
-
150
-
151
-
152
-
153
-
154
-
155
-
156
-
157
-
158
-
159
-
160
-
161
-
162
-
163
-
164
-
165
-
166
-
167
-
168
-
169
-
170
-
171
-
172
-
173
-
174
-
175
-
176
-
177
-
178
-
179
-
180
-
181
-
182
-
183
-
184
-
185
-
186
-
187
-
188
-
189
-
190
-
191
-
192
-
193
-
194
-
195
-
196
-
197
-
198
-
199
-
200
-
201
-
202
-
203
-
204
-
205
-
206
-
207
-
208
-
209
-
210
-
211
-
212
-
213
-
214
-
215
-
216
-
217
-
218
-
219
-
220
-
221
-
222
-
223
-
224
-
225
-
226
-
227
-
228
-
229
-
230
-
231
-
232
-
233
-
234
-
235
-
236
-
237
-
238
-
239
-
240
 |
 |
Table of Contents
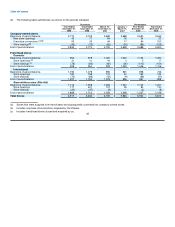
(3) The following table summarizes our stores for the periods indicated:
Successor Predecessor
Year Ended Year Ended March 16- January 1- Year Ended Year Ended
December 31, December 31, December 31, March 15, December 31, December 31,
2009 2008 2007 2007 2006 2005
Company-owned stores
Beginning of period balance 2,774 2,745 2,699 2,688 2,650 2,642
New store openings 45 71 64 18 54 35
Franchise conversions (a)(b) 53 33 44 17 80 102
Store closings(b) (40) (75) (62) (24) (96) (129)
End of period balance 2,832 2,774 2,745 2,699 2,688 2,650
Franchised stores
Domestic
Beginning of period balance 954 978 1,022 1,046 1,156 1,290
Store openings (b) 31 41 16 4 5 17
Store closings (c) (76) (65) (60) (28) (115) (151)
End of period balance 909 954 978 1,022 1,046 1,156
International
Beginning of period balance 1,190 1,078 996 961 858 746
Store openings 187 198 115 44 169 132
Store closings (70) (86) (33) (9) (66) (20)
End of period balance 1,307 1,190 1,078 996 961 858
Store-within-a-store (Rite Aid)
Beginning of period balance 1,712 1,358 1,266 1,227 1,149 1,027
Store openings 177 401 101 39 80 130
Store closings (20) (47) (9) — (2) (8)
End of period balance 1,869 1,712 1,358 1,266 1,227 1,149
Total Stores 6,917 6,630 6,159 5,983 5,922 5,813
(a) Stores that were acquired from franchisees and subsequently converted into company-owned stores.
(b) Includes corporate store locations acquired by franchisees.
(c) Includes franchised stores closed and acquired by us. 42