GNC 2010 Annual Report Download - page 51
Download and view the complete annual report
Please find page 51 of the 2010 GNC annual report below. You can navigate through the pages in the report by either clicking on the pages listed below, or by using the keyword search tool below to find specific information within the annual report.-
 1
1 -
2
-
3
-
4
-
5
-
6
-
7
-
8
-
9
-
10
-
11
-
12
-
13
-
14
-
15
-
16
-
17
-
18
-
19
-
20
-
21
-
22
-
23
-
24
-
25
-
26
-
27
-
28
-
29
-
30
-
31
-
32
-
33
-
34
-
35
-
36
-
37
-
38
-
39
-
40
-
 41
41 -
 42
42 -
 43
43 -
 44
44 -
 45
45 -
 46
46 -
 47
47 -
 48
48 -
 49
49 -
 50
50 -
 51
51 -
 52
52 -
 53
53 -
 54
54 -
 55
55 -
 56
56 -
 57
57 -
 58
58 -
 59
59 -
 60
60 -
 61
61 -
62
-
63
-
64
-
65
-
66
-
67
-
68
-
69
-
70
-
71
-
72
-
73
-
74
-
75
-
76
-
77
-
78
-
79
-
80
-
81
-
82
-
83
-
84
-
85
-
86
-
87
-
88
-
89
-
90
-
91
-
92
-
93
-
94
-
95
-
96
-
97
-
98
-
99
-
100
-
101
-
102
-
103
-
104
-
105
-
106
-
107
-
108
-
109
-
110
-
111
-
112
-
113
-
114
-
115
-
116
-
117
-
118
-
119
-
120
-
121
-
122
-
123
-
124
-
125
-
126
-
127
-
128
-
129
-
130
-
131
-
132
-
133
-
134
-
135
-
136
-
137
-
138
-
139
-
140
-
141
-
142
-
143
-
144
-
145
-
146
-
147
-
148
-
149
-
150
-
151
-
152
-
153
-
154
-
155
-
156
-
157
-
158
-
159
-
160
-
161
-
162
-
163
-
164
-
165
-
166
-
167
-
168
-
169
-
170
-
171
-
172
-
173
-
174
-
175
-
176
-
177
-
178
-
179
-
180
-
181
-
182
-
183
-
184
-
185
-
186
-
187
-
188
-
189
-
190
-
191
-
192
-
193
-
194
-
195
-
196
-
197
-
198
-
199
-
200
-
201
-
202
-
203
-
204
-
205
-
206
-
207
-
208
-
209
-
210
-
211
-
212
-
213
-
214
-
215
-
216
-
217
-
218
-
219
-
220
-
221
-
222
-
223
-
224
-
225
-
226
-
227
-
228
-
229
-
230
-
231
-
232
-
233
-
234
-
235
-
236
-
237
-
238
-
239
-
240
 |
 |

Table of Contents
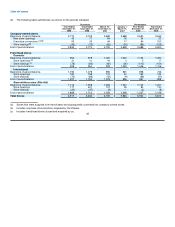
to grow and strengthen our presence globally, with the addition of 117 and 112 net new locations in 2009 and 2008, respectively. For 2009, the
international franchise business recognized a 9.8% increase in revenue, compared with 2008, primarily on the strength of higher product sales.
Our manufacturing strategy is designed to provide our stores with proprietary products at the lowest possible cost, and utilize additional
capacity to promote production efficiencies and enhance our position in the third party contract business. Under this strategy, our third party
manufacturing sales grew 38.7% and 3.8% in 2008 and 2009, respectively, over the prior year periods. We expect continuing steady
performance from our manufacturing plant utilizing this strategy.
We believe that the strength of our brand and our leadership position in the health and wellness sector provide significant future
opportunities to capitalize on favorable demographics and consumer trends. In our experience, our customers have continued to focus on their
personal health and well-being during economic downturns; nonetheless, a continued downturn or an uncertain outlook in the economy may
materially and adversely affect our business and financial results.
While our 2009 results do not reflect a negative impact due to the general downturn of the economy, the downturn could affect our
business and operating results in the future. Our results depend on a number of factors impacting consumer spending, including, but not limited
to, general economic and business conditions, consumer confidence, consumer debt levels, availability of consumer credit, and the level of
customer traffic within malls and other shopping environments. Consumer purchases of products, including ours and those of our partners, may
decline during recessionary periods.
If consumer purchases of products decline, we could be impacted in the following ways:
• retail sales at our company stores and through our website could decline;
• demand for our branded products produced at our manufacturing plant could decline;
• demand for products produced for distributors and other retailers / wholesalers could diminish;
• our domestic franchisees may choose not to renew their franchise licenses, which in turn would lower our franchise product
revenue; and
• our international franchisees may experience decreased revenue resulting in lower royalties and product revenue to us; additionally,
a strengthening of the U.S. dollar may impact us, as our international franchisees purchase inventory from and pay royalties to us in
U.S. dollars.
In May 2009, the FDA warned consumers to stop using certain Hydroxycut products, produced by Iovate Health Sciences, Inc., which
were sold in our stores. Iovate issued a voluntary recall, with which we immediately fully complied. Sales of the recalled Hydroxycut products
amounted to approximately $57.8 million, or 4.7% of our retail sales in 2008 and $18.8 million, or 4.2% of our retail sales in the first four months
of 2009. We provided refunds or gift cards to consumers who returned these products to our stores. In the second quarter, we experienced a
reduction in sales and margin due to the recall as a result of accepting returns of products from customers and a loss of sales as a Hydroxycut
replacement product was not available. Through December 31, 2009, we had refunded approximately $3.5 million to our retail customers and
approximately $1.6 million to our wholesale customers for Hydroxycut product returns. A significant majority of the retail refunds occurred in our
second quarter; the wholesale refunds were recognized in the early part of the third quarter. All returns of product by our customers were
recognized as a reduction in sales in the period when the return occurred. At the end of June, Iovate launched new reformulated Hydroxycut
products that we began to sell in our stores. Although post-recall sales of the new reformulated Hydroxycut trailed pre-recall levels, strong sales
in our core sports, vitamins and herbs products, along with other new third party diet products, helped to mitigate the decrease in sales from the
Hydroxycut product line.
In light of these matters, we continue to focus on our core strategies. In the near term, we will concentrate on our primary strategies, in
particular: 45