GNC 2010 Annual Report Download - page 50
Download and view the complete annual report
Please find page 50 of the 2010 GNC annual report below. You can navigate through the pages in the report by either clicking on the pages listed below, or by using the keyword search tool below to find specific information within the annual report.
Table of Contents
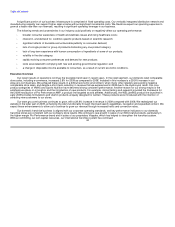
A significant portion of our business infrastructure is comprised of fixed operating costs. Our vertically integrated distribution network and
manufacturing capacity can support higher sales volume without significant incremental costs. We therefore expect our operating expenses to
grow at a lesser rate than our revenues, resulting in significant operating leverage in our business.
The following trends and uncertainties in our industry could positively or negatively affect our operating performance:
• broader consumer awareness of health and wellness issues and rising healthcare costs;
• interest in, and demand for, condition-specific products based on scientific research;
• significant effects of favorable and unfavorable publicity on consumer demand;
• lack of a single product or group of products dominating any one product category;
• lack of long-term experience with human consumption of ingredients of some of our products;
• volatility in the diet category;
• rapidly evolving consumer preferences and demand for new products;
• costs associated with complying with new and existing governmental regulation; and
• a change in disposable income available to consumers, as a result of current economic conditions.
Executive Overview
Our recent results of operations continue the favorable trend seen in recent years. In the retail segment, our domestic retail comparable
store sales, including e-commerce, increased 2.8% for 2009 as compared to 2008. Included in this increase is a 29.9% increase in our
www.gnc.com business. We achieved these results in a difficult economic environment, when many other retailers were posting negative
comparable store sales, and despite a short-term reduction in revenue that we experienced in 2009 due to the Hydroxycut recall. Our core
product categories of VMHS and Sports Nutrition have delivered strong consistent performance. Another reason for our strong results is the
emphasis we place on innovation and the introduction of new products. For example, clinical testing and research provided the framework for
the 2009 introduction of Pro Performance AMP, a product line targeted at avid athletes. Additionally, the WELLbeING product line launched in
early 2009 provides formulations and vitamin products uniquely designed for women. These products were introduced with the intention of
attracting new customers to our stores.
Our www.gnc.com business continues to grow, with a 29.9% increase in revenue in 2009 compared with 2008. We redesigned our
website in the latter part of 2009, enhancing the site's functionality through improved search capabilities, navigation and expanded content. We
expect these enhancements to allow us to continue to grow our revenue through increased traffic and conversion rates.
Our domestic franchise business is aligned with our corporate operating standards, and key performance indicators to our domestic
franchise stores are consistent with our company store results. We continue to see growth in sales of our GNC brand products, particularly in
the higher margin Pro Performance brand and in sales of our proprietary Vitapaks, which has helped to strengthen the franchise system.
Without committing our own capital resources, our international franchise system has continued
44


