GNC 2010 Annual Report Download - page 115
Download and view the complete annual report
Please find page 115 of the 2010 GNC annual report below. You can navigate through the pages in the report by either clicking on the pages listed below, or by using the keyword search tool below to find specific information within the annual report.-
 1
1 -
2
-
3
-
4
-
5
-
6
-
7
-
8
-
9
-
10
-
11
-
12
-
13
-
14
-
15
-
16
-
17
-
18
-
19
-
20
-
21
-
22
-
23
-
24
-
25
-
26
-
27
-
28
-
29
-
30
-
31
-
32
-
33
-
34
-
35
-
36
-
37
-
38
-
39
-
40
-
41
-
42
-
43
-
44
-
45
-
46
-
47
-
48
-
49
-
50
-
51
-
52
-
53
-
54
-
55
-
56
-
57
-
58
-
59
-
60
-
61
-
62
-
63
-
64
-
65
-
66
-
67
-
68
-
69
-
70
-
71
-
72
-
73
-
74
-
75
-
76
-
77
-
78
-
79
-
80
-
81
-
82
-
83
-
84
-
85
-
86
-
87
-
88
-
89
-
90
-
91
-
92
-
93
-
94
-
95
-
96
-
97
-
98
-
99
-
100
-
101
-
102
-
103
-
104
-
 105
105 -
 106
106 -
 107
107 -
 108
108 -
 109
109 -
 110
110 -
 111
111 -
 112
112 -
 113
113 -
 114
114 -
 115
115 -
 116
116 -
 117
117 -
 118
118 -
 119
119 -
 120
120 -
 121
121 -
 122
122 -
 123
123 -
 124
124 -
 125
125 -
126
-
127
-
128
-
129
-
130
-
131
-
132
-
133
-
134
-
135
-
136
-
137
-
138
-
139
-
140
-
141
-
142
-
143
-
144
-
145
-
146
-
147
-
148
-
149
-
150
-
151
-
152
-
153
-
154
-
155
-
156
-
157
-
158
-
159
-
160
-
161
-
162
-
163
-
164
-
165
-
166
-
167
-
168
-
169
-
170
-
171
-
172
-
173
-
174
-
175
-
176
-
177
-
178
-
179
-
180
-
181
-
182
-
183
-
184
-
185
-
186
-
187
-
188
-
189
-
190
-
191
-
192
-
193
-
194
-
195
-
196
-
197
-
198
-
199
-
200
-
201
-
202
-
203
-
204
-
205
-
206
-
207
-
208
-
209
-
210
-
211
-
212
-
213
-
214
-
215
-
216
-
217
-
218
-
219
-
220
-
221
-
222
-
223
-
224
-
225
-
226
-
227
-
228
-
229
-
230
-
231
-
232
-
233
-
234
-
235
-
236
-
237
-
238
-
239
-
240
 |
 |
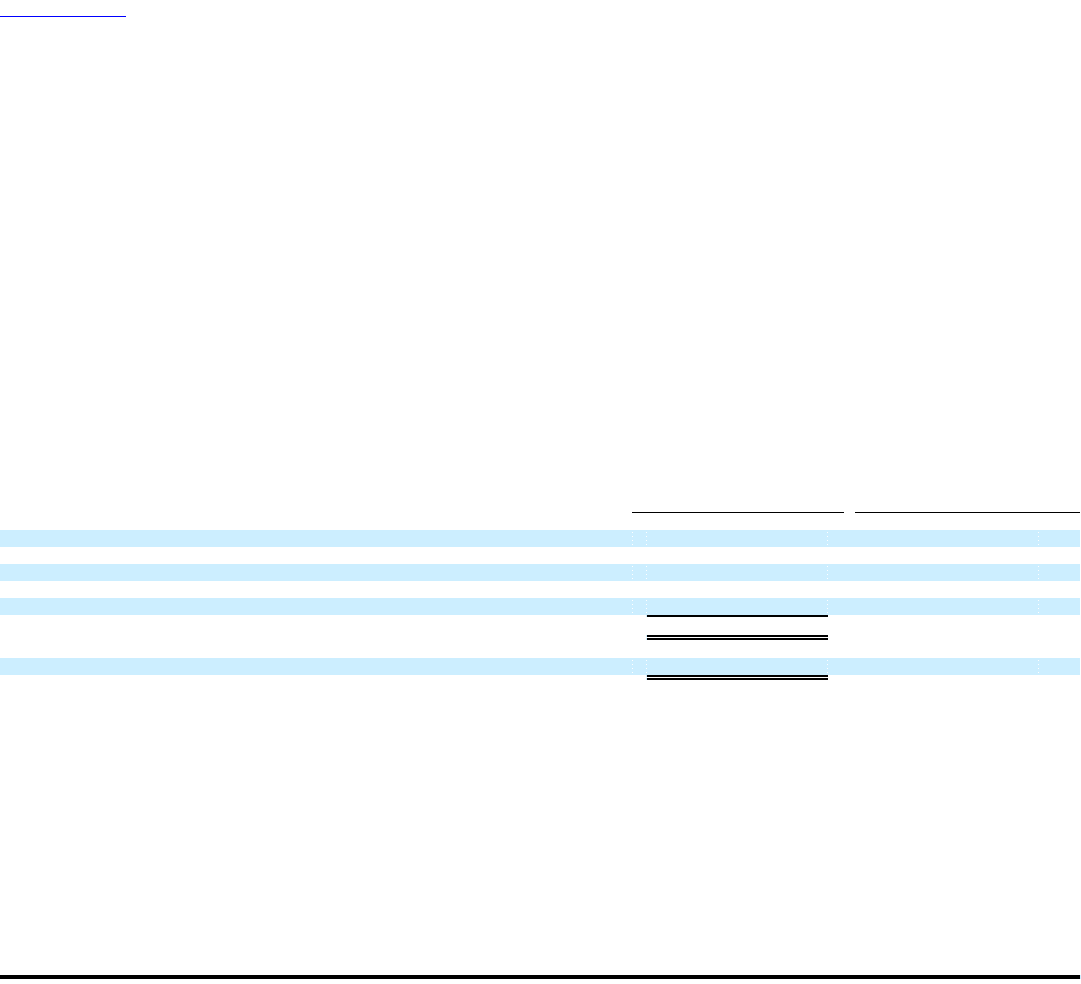
Table of Contents
GENERAL NUTRITION CENTERS, INC. AND SUBSIDIARIES
NOTES TO THE CONSOLIDATED FINANCIAL STATEMENTS
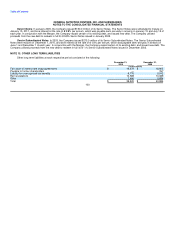
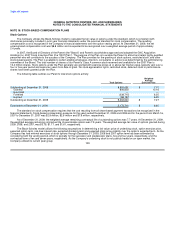
NOTE 18. STOCK-BASED COMPENSATION PLANS
Stock Options
The Company utilizes the Black-Scholes model to calculate the fair value of options under the standard, which is consistent with
disclosures previously included in prior year financial statements under the previous standard for stock compensation. The resulting
compensation cost is recognized in the Company's financial statements over the option vesting period. At December 31, 2009, the net
unrecognized compensation cost was $8.8 million and is expected to be recognized over a weighted average period of approximately
2.4 years.
In 2007, the Board of Directors of the Parent (the "Board") and Parent's stockholders approved and adopted the GNC Acquisition
Holdings Inc. 2007 Stock Incentive Plan (the "2007 Plan"). The purpose of the Plan is to enable the Parent to attract and retain highly qualified
personnel who will contribute to the success of the Company. The Plan provides for the granting of stock options, restricted stock, and other
stock-based awards. The Plan is available to certain eligible employees, directors, consultants or advisors as determined by the administering
committee of the Board. The total number of shares of our Parent's Class A common stock reserved and available for the 2007 Plan is
10.4 million shares. Stock options under the Plan generally are granted with exercise prices at or above fair market value, typically vest over a
four or five-year period and expire ten years from date of grant. No stock appreciation rights, restricted stock, deferred stock or performance
shares have been granted under the Plan.
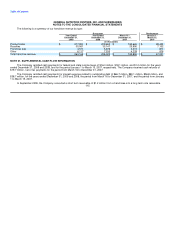
The following table outlines our Parent's total stock options activity:
Weighted
Average
Total Options Exercise Price
Outstanding at December 31, 2008 8,883,692 $ 7.10
Granted 806,850 10.16
Exercised — —
Forfeited (338,715) 6.25
Expired (88,187) 6.25
Outstanding at December 31, 2009 9,263,640 $ 7.27
Exercisable at December 31, 2009 3,173,710 $ 6.65
The standard on stock compensation requires that the cost resulting from all share-based payment transactions be recognized in the
financial statements. Stock-based compensation expense for the years ended December 31, 2009 and 2008 and for the period from March 16,
2007 to December 31, 2007 was $2.9 million, $2.6 million and $1.9 million, respectively.
As of December 31, 2009, the weighted average remaining contractual life of outstanding options was 7.7 years. At December 31, 2009,
the weighted average remaining contractual life of exercisable options was 7.9 years. The weighted average fair value of options granted during
2009, 2008, and 2007, was $3.19, $1.17, and $1.61, respectively.
The Black-Scholes model utilizes the following assumptions in determining a fair value: price of underlying stock, option exercise price,
expected option term, risk-free interest rate, expected dividend yield, and expected stock price volatility over the option's expected term. As the
Company has had minimal exercises of stock options through December 31, 2009, 2008 and 2007 option term has been estimated by
considering both the vesting period, which is typically for the successor and predecessor plans, five and four years, respectively, and the
contractual term of ten and seven years, respectively. As the Company's underlying stock is not publicly traded on an open market, the
Company utilized its current peer group 109