GNC 2010 Annual Report Download - page 57
Download and view the complete annual report
Please find page 57 of the 2010 GNC annual report below. You can navigate through the pages in the report by either clicking on the pages listed below, or by using the keyword search tool below to find specific information within the annual report.-
 1
1 -
2
-
3
-
4
-
5
-
6
-
7
-
8
-
9
-
10
-
11
-
12
-
13
-
14
-
15
-
16
-
17
-
18
-
19
-
20
-
21
-
22
-
23
-
24
-
25
-
26
-
27
-
28
-
29
-
30
-
31
-
32
-
33
-
34
-
35
-
36
-
37
-
38
-
39
-
40
-
41
-
42
-
43
-
44
-
45
-
46
-
 47
47 -
 48
48 -
 49
49 -
 50
50 -
 51
51 -
 52
52 -
 53
53 -
 54
54 -
 55
55 -
 56
56 -
 57
57 -
 58
58 -
 59
59 -
 60
60 -
 61
61 -
 62
62 -
 63
63 -
 64
64 -
 65
65 -
 66
66 -
 67
67 -
68
-
69
-
70
-
71
-
72
-
73
-
74
-
75
-
76
-
77
-
78
-
79
-
80
-
81
-
82
-
83
-
84
-
85
-
86
-
87
-
88
-
89
-
90
-
91
-
92
-
93
-
94
-
95
-
96
-
97
-
98
-
99
-
100
-
101
-
102
-
103
-
104
-
105
-
106
-
107
-
108
-
109
-
110
-
111
-
112
-
113
-
114
-
115
-
116
-
117
-
118
-
119
-
120
-
121
-
122
-
123
-
124
-
125
-
126
-
127
-
128
-
129
-
130
-
131
-
132
-
133
-
134
-
135
-
136
-
137
-
138
-
139
-
140
-
141
-
142
-
143
-
144
-
145
-
146
-
147
-
148
-
149
-
150
-
151
-
152
-
153
-
154
-
155
-
156
-
157
-
158
-
159
-
160
-
161
-
162
-
163
-
164
-
165
-
166
-
167
-
168
-
169
-
170
-
171
-
172
-
173
-
174
-
175
-
176
-
177
-
178
-
179
-
180
-
181
-
182
-
183
-
184
-
185
-
186
-
187
-
188
-
189
-
190
-
191
-
192
-
193
-
194
-
195
-
196
-
197
-
198
-
199
-
200
-
201
-
202
-
203
-
204
-
205
-
206
-
207
-
208
-
209
-
210
-
211
-
212
-
213
-
214
-
215
-
216
-
217
-
218
-
219
-
220
-
221
-
222
-
223
-
224
-
225
-
226
-
227
-
228
-
229
-
230
-
231
-
232
-
233
-
234
-
235
-
236
-
237
-
238
-
239
-
240
 |
 |

Table of Contents
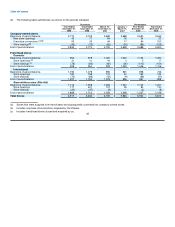
Comparison of the Year Ended December 31, 2008 and the Successor Period 2007 — March 16, 2007 to December 31, 2007
The following discussion compares the results of operations of the year ended December 31, 2008 to the Successor Period March 16, 2007 to
December 31, 2007 ("2007 Successor Period"). Our results of operations from period to period may not be comparable because the 2007
Sucessor Period was only 291 days.
Revenues
Our consolidated net revenues increased $433.7 million, or 35.5%, to $1,656.7 million for the year ended December 31, 2008 compared
to $1,223.0 million for the 2007 Successor Period, due to increased sales in each of our segments, and a result of comparing a 366 day period
to a 291 day period.
Retail. Revenues in our Retail segment increased $310.0 million, or 34.1%, to $1,219.3 million for the year ended December 31, 2008
compared to $909.3 million for the 2007 Successor Period. The increase from the 2007 Successor Period to the year ended December 31,
2008 included an increase of $14.4 million of sales through www.gnc.com. Sales increases occurred in each of the major product categories of
VMHS and sports nutrition. Our company-owned store base increased by 16 domestic stores to 2,614 compared to 2,598 at December 31,
2007, primarily due to new store openings and franchise store acquisitions, and by 13 Canadian stores to 160 at December 31, 2008 compared
to 147 at December 31, 2007.
Franchise. Revenues in our Franchise segment increased $64.1 million, or 33.1%, to $258.0 million for the year ended December 31,
2008 compared to $193.9 million for the 2007 Successor Period. The increase is primarily due to comparing a 366 day period to a 291 day
period. Domestic franchise revenue increased $42.1 million as a result of increased product sales despite operating 24 fewer stores during
2008 compared to 2007. There were 954 stores at December 31, 2008 compared to 978 stores at December 31, 2007. International franchise
revenue increased $22.0 million as a result of increased product sales and royalties. Our international franchise store base increased by 112
stores to 1,190 at December 31, 2008 compared to 1,078 at December 31, 2007.
Manufacturing/Wholesale. Revenues in our Manufacturing/Wholesale segment, which includes third-party sales from our manufacturing
facilities in South Carolina, as well as wholesale sales to Rite Aid and www.drugstore.com, increased $59.6 million, or 49.7%, to $179.4 million
for the year ended December 31, 2008 compared to $119.8 million for the 2007 Successor Period. Sales increased in the South Carolina plant
by $46.6 million, and revenues associated with Rite Aid increased by $11.4 million due primarily due to increased license fees as a result of
Rite Aid opening 401 stores for the year ended December 31, 2008 as opposed to 101 stores for the 2007 Successor Period.
Cost of Sales
Consolidated cost of sales, which includes product costs, costs of warehousing and distribution and occupancy costs, increased
$268.4 million, or 33.0%, to $1,082.6 million for the year ended December 31, 2008 compared to $814.2 million for the 2007 Successor Period.
The increase is primarily due to comparing a 366 day period to a 291 day period. Consolidated cost of sales, as a percent of net revenue,
decreased to 65.3% in the year ended December 31, 2008 compared to 66.5% for the 2007 Successor Period.
Product costs. Product costs increased $201.4 million, or 33.1%, to $810.5 million for the year ended December 31, 2008 compared to
$609.1 million for the 2007 Successor Period. The increase is primarily due to comparing a 366 day period to a 291 day period. To a lesser
extent, the increased product costs were the result of increased sales volumes and rising raw material prices. Product costs for the year ended
December 31, 2007 include $15.5 million of non-cash expense from amortization of inventory step up to fair value due to the Merger.
Consolidated product costs, as a percentage of net revenue, declined to 48.9% for the year ended December 31, 2008 compared to 49.8% for
the 2007 Successor Period. 51