Express Scripts 2012 Annual Report Download - page 94
Download and view the complete annual report
Please find page 94 of the 2012 Express Scripts annual report below. You can navigate through the pages in the report by either clicking on the pages listed below, or by using the keyword search tool below to find specific information within the annual report.-
 1
1 -
2
-
3
-
4
-
5
-
6
-
7
-
8
-
9
-
10
-
11
-
12
-
13
-
14
-
15
-
16
-
17
-
18
-
19
-
20
-
21
-
22
-
23
-
24
-
25
-
26
-
27
-
28
-
29
-
30
-
31
-
32
-
33
-
34
-
35
-
36
-
37
-
38
-
39
-
40
-
41
-
42
-
43
-
44
-
45
-
46
-
47
-
48
-
49
-
50
-
51
-
52
-
53
-
54
-
55
-
56
-
57
-
58
-
59
-
60
-
61
-
62
-
63
-
64
-
65
-
66
-
67
-
68
-
69
-
70
-
71
-
72
-
73
-
74
-
75
-
76
-
77
-
78
-
79
-
80
-
81
-
82
-
83
-
 84
84 -
 85
85 -
 86
86 -
 87
87 -
 88
88 -
 89
89 -
 90
90 -
 91
91 -
 92
92 -
 93
93 -
 94
94 -
 95
95 -
 96
96 -
 97
97 -
 98
98 -
 99
99 -
 100
100 -
 101
101 -
 102
102 -
 103
103 -
 104
104 -
105
-
106
-
107
-
108
-
109
-
110
-
111
-
112
-
113
-
114
-
115
-
116
-
117
-
118
-
119
-
120
 |
 |

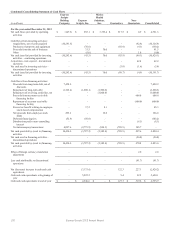
Express Scripts 2012 Annual Report92
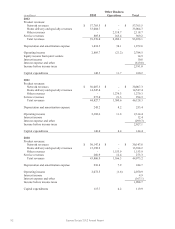
(in millions)
PBM
Other Business
Operations
Total
2012
Product revenues:
Network revenues
$ 57,765.5
$ -
$ 57,765.5
Home delivery and specialty revenues
33,004.7
-
33,004.7
Other revenues
-
2,118.7
2,118.7
Service revenues
805.8
163.4
969.2
Total revenues
91,576.0
2,282.1
93,858.1
Depreciation and amortization expense
1,834.5
38.1
1,872.6
Operating income
2,805.7
(21.2)
2,784.5
Equity income from joint venture
14.9
Interest income
10.6
Interest expense and other
(619.0)
Income before income taxes
2,191.0
Capital expenditures
148.5
11.7
160.2
2011
Product revenues:
Network revenues
$ 30,007.3
$ -
$ 30,007.3
Home delivery and specialty revenues
14,547.4
-
14,547.4
Other revenues
-
1,279.3
1,279.3
Service revenues
273.0
21.3
294.3
Total revenues
44,827.7
1,300.6
46,128.3
Depreciation and amortization expense
245.2
8.2
253.4
Operating income
2,302.6
11.8
2,314.4
Interest income
12.4
Interest expense and other
(299.7)
Income before income taxes
2,027.1
Capital expenditures
140.0
4.4
144.4
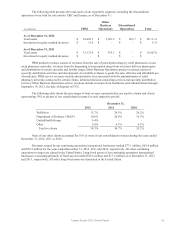
2010
Product revenues:
Network revenues
$ 30,147.8
$ -
$ 30,147.8
Home delivery and specialty revenues
13,398.2
-
13,398.2
Other revenues
-
1,153.9
1,153.9
Service revenues
260.9
12.4
273.3
Total revenues
43,806.9
1,166.3
44,973.2
Depreciation and amortization expense
236.8
7.9
244.7
Operating income
2,072.5
(1.6)
2,070.9
Interest income
4.9
Interest expense and other
(167.1)
Income before income taxes
1,908.7
Capital expenditures
115.7
4.2
119.9