Express Scripts 2012 Annual Report Download - page 46
Download and view the complete annual report
Please find page 46 of the 2012 Express Scripts annual report below. You can navigate through the pages in the report by either clicking on the pages listed below, or by using the keyword search tool below to find specific information within the annual report.-
 1
1 -
2
-
3
-
4
-
5
-
6
-
7
-
8
-
9
-
10
-
11
-
12
-
13
-
14
-
15
-
16
-
17
-
18
-
19
-
20
-
21
-
22
-
23
-
24
-
25
-
26
-
27
-
28
-
29
-
30
-
31
-
32
-
33
-
34
-
35
-
 36
36 -
 37
37 -
 38
38 -
 39
39 -
 40
40 -
 41
41 -
 42
42 -
 43
43 -
 44
44 -
 45
45 -
 46
46 -
 47
47 -
 48
48 -
 49
49 -
 50
50 -
 51
51 -
 52
52 -
 53
53 -
 54
54 -
 55
55 -
 56
56 -
57
-
58
-
59
-
60
-
61
-
62
-
63
-
64
-
65
-
66
-
67
-
68
-
69
-
70
-
71
-
72
-
73
-
74
-
75
-
76
-
77
-
78
-
79
-
80
-
81
-
82
-
83
-
84
-
85
-
86
-
87
-
88
-
89
-
90
-
91
-
92
-
93
-
94
-
95
-
96
-
97
-
98
-
99
-
100
-
101
-
102
-
103
-
104
-
105
-
106
-
107
-
108
-
109
-
110
-
111
-
112
-
113
-
114
-
115
-
116
-
117
-
118
-
119
-
120
 |
 |

Express Scripts 2012 Annual Report44
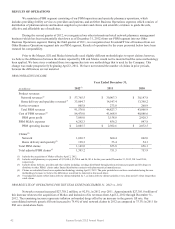
increases were partially offset by a decrease in volume and an increase in the generic fill rate. Additionally, included in the
cost of PBM revenues for the year ended December 31, 2010 is $94.5 million of integration costs related to the acquisition
of NextRx.
PBM gross profit increased $238.5 million, or 8.2%, in 2011 over 2010, based on the various factors described
above.
SG&A for the PBM segment increased $8.4 million in 2011 over 2010. Costs of $62.5 million incurred during
2011 related to the Merger and accelerated spending on certain projects in 2011, discussed above, as well as $11.0 million
related to a proposed settlement of state tax audits, were partially offset by decreases in management compensation and
integration costs of $28.1 million during 2010 related to the acquisition of NextRx.
PBM operating income increased $230.1 million, or 11.1%, in 2011 over 2010, based on the various factors
described above.
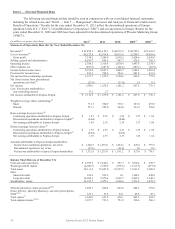
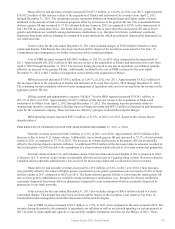
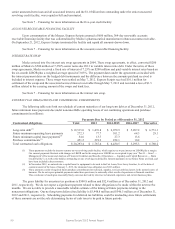
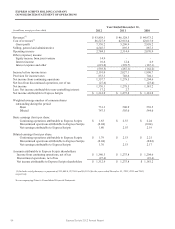
OTHER BUSINESS OPERATIONS OPERATING INCOME
Year Ended December 31,
(in millions)
2012
(1)
2011
2010
Product revenues
$ 2,118.7
$ 1,279.3
$ 1,153.9
Service revenues
163.4
21.3
12.4
Total Other Business Operations revenues
2,282.1
1,300.6
1,166.3
Cost of Other Business Operations revenues
2,049.9
1,249.5
1,128.4
Other Business Operations gross profit
232.2
51.1
37.9
Other Business Operations SG&A expenses
253.4
39.3
39.5
Other Business Operations operating income
$ (21.2)
$ 11.8
$ (1.6)
Claims
Home delivery and specialty—continuing operations
0.8
-
-
Total adjusted Other Business Operations claims—
continuing operations(2)
2.5
-
-
Home delivery and specialty—discontinued operations
4.9
-
-
Total adjusted Other Business Operations claims—
discontinued operations
(2)
14.7
-
-
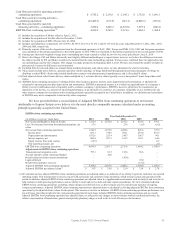
(1) Our Other Business Operations results for the year ended December 31, 2012 excludes discontinued operations of EAV, UBC, and Europe,
which were included in the Other Business Operations segment in the second and third quarters of 2012 following consummation of the
Merger.
(2) Total adjusted claims reflect home delivery claims multiplied by 3, as home delivery claims typically cover a time period 3 times longer than
retail claims.
OTHER BUSINESS OPERATIONS RESULTS OF OPERATIONS
Other Business Operations operating income decreased $33.0 million, or 279.7%, in 2012 over 2011. This
decrease is due primarily to the inclusion of amounts related to Medco, the impact of impairment charges less the gain upon
sale associated with Liberty, netting to a loss of $22.5 million, as discussed in Note 4 – Dispositions and Note 6 – Goodwill
and intangibles, and losses attributed to other international businesses. Offsetting these losses is $14.3 million gain
associated with the sale of ConnectYourCare (“CYC”) as discussed in Note 4 – Dispositions.
Other Business Operations operating income increased $13.4 million in 2011 over 2010. This increase is due to an
increase in volume across all lines of business within the segment, partially offset by cost inflation.
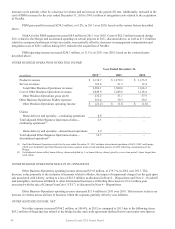
OTHER (EXPENSE) INCOME, NET
Net other expense increased $306.2 million, or 106.6%, in 2012 as compared to 2011 due to the following items:
$85.2 million of financing fees related to the bridge facility and credit agreement (defined below) and senior note interest