Express Scripts 2012 Annual Report Download - page 118
Download and view the complete annual report
Please find page 118 of the 2012 Express Scripts annual report below. You can navigate through the pages in the report by either clicking on the pages listed below, or by using the keyword search tool below to find specific information within the annual report.-
 1
1 -
2
-
3
-
4
-
5
-
6
-
7
-
8
-
9
-
10
-
11
-
12
-
13
-
14
-
15
-
16
-
17
-
18
-
19
-
20
-
21
-
22
-
23
-
24
-
25
-
26
-
27
-
28
-
29
-
30
-
31
-
32
-
33
-
34
-
35
-
36
-
37
-
38
-
39
-
40
-
41
-
42
-
43
-
44
-
45
-
46
-
47
-
48
-
49
-
50
-
51
-
52
-
53
-
54
-
55
-
56
-
57
-
58
-
59
-
60
-
61
-
62
-
63
-
64
-
65
-
66
-
67
-
68
-
69
-
70
-
71
-
72
-
73
-
74
-
75
-
76
-
77
-
78
-
79
-
80
-
81
-
82
-
83
-
84
-
85
-
86
-
87
-
88
-
89
-
90
-
91
-
92
-
93
-
94
-
95
-
96
-
97
-
98
-
99
-
100
-
101
-
102
-
103
-
104
-
105
-
106
-
107
-
 108
108 -
 109
109 -
 110
110 -
 111
111 -
 112
112 -
 113
113 -
 114
114 -
 115
115 -
 116
116 -
 117
117 -
 118
118 -
 119
119 -
 120
120
 |
 |
Express Scripts 2012 Annual Report116
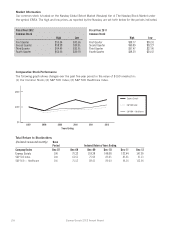
Market Information
Our common stock is traded on the Nasdaq Global Select Market (Nasdaq) tier of The Nasdaq Stock Market under
the symbol ESRX. The high and low prices, as reported by the Nasdaq, are set forth below for the periods indicated.
Fiscal Year 2012
Common Stock
High Low
First Quarter $55.34 $45.66
Second Quarter $58.98 $50.31
Third Quarter $64.46 $53.61
Fourth Quarter $66.06 $49.79
Fiscal Year 2011
Common Stock
High Low
First Quarter $58.77 $50.91
Second Quarter $60.89 $52.27
Third Quarter $57.47 $37.06
Fourth Quarter $48.39 $34.47
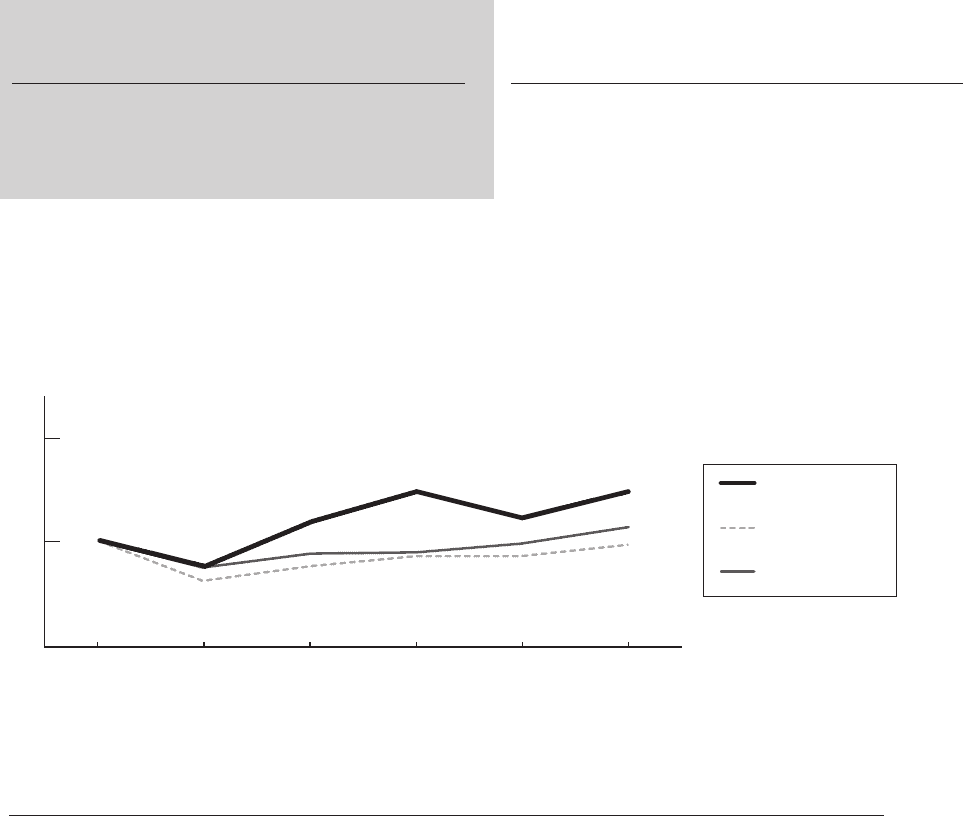
Comparative Stock Performance
The following graph shows changes over the past five-year period in the value of $100 invested in:
(1) Our Common Stock; (2) S&P 500 Index; (3) S&P 500 Healthcare Index.
Total Return to Stockholders
(Dividends reinvested monthly) Base
Period Indexed Returns Years Ending
Company/Index Dec-07 Dec-08 Dec-09 Dec-10 Dec-11 Dec-12
Express Scripts 100 75.32 118.38 148.08 122.44 147.95
S&P 500 Index 100 61.51 75.94 85.65 85.65 97.13
S&P 500
—
Healthcare 100 75.52 88.41 89.04 98.10 113.00
$0
$100
$200
2007 2008 2009
Years Ending
2010 2011 2012
Express Scripts
S&P 500 Index
S&P 500
—
Healthcare