Express Scripts 2012 Annual Report Download - page 75
Download and view the complete annual report
Please find page 75 of the 2012 Express Scripts annual report below. You can navigate through the pages in the report by either clicking on the pages listed below, or by using the keyword search tool below to find specific information within the annual report.-
 1
1 -
2
-
3
-
4
-
5
-
6
-
7
-
8
-
9
-
10
-
11
-
12
-
13
-
14
-
15
-
16
-
17
-
18
-
19
-
20
-
21
-
22
-
23
-
24
-
25
-
26
-
27
-
28
-
29
-
30
-
31
-
32
-
33
-
34
-
35
-
36
-
37
-
38
-
39
-
40
-
41
-
42
-
43
-
44
-
45
-
46
-
47
-
48
-
49
-
50
-
51
-
52
-
53
-
54
-
55
-
56
-
57
-
58
-
59
-
60
-
61
-
62
-
63
-
64
-
 65
65 -
 66
66 -
 67
67 -
 68
68 -
 69
69 -
 70
70 -
 71
71 -
 72
72 -
 73
73 -
 74
74 -
 75
75 -
 76
76 -
 77
77 -
 78
78 -
 79
79 -
 80
80 -
 81
81 -
 82
82 -
 83
83 -
 84
84 -
 85
85 -
86
-
87
-
88
-
89
-
90
-
91
-
92
-
93
-
94
-
95
-
96
-
97
-
98
-
99
-
100
-
101
-
102
-
103
-
104
-
105
-
106
-
107
-
108
-
109
-
110
-
111
-
112
-
113
-
114
-
115
-
116
-
117
-
118
-
119
-
120
 |
 |

Express Scripts 2012 Annual Report 73
ons
72
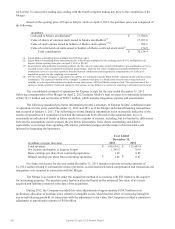
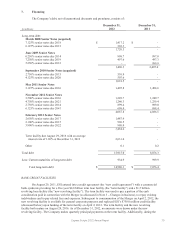
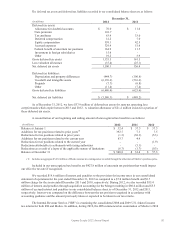
6. Goodwill and other intangibles
During the second quarter of 2012, we reorganized our segments to better reflect our structure following
the Merger. Our new segment structure is composed of our PBM segment and our Other Business Operations
segment. See Note 13 – Segment information for further description of the services performed by each segment.
Historical segment information has been retrospectively adjusted to reflect the effect of these changes. The
following is a summary of our goodwill and other intangible assets for our two reportable segments, PBM and Other
Business Operations:
December 31, 2012
December 31, 2011
(in millions)
Gross
Carrying
Amount
Accumulated
Amortization
Net
Carrying
Amount
Gross
Carrying
Amount
Accumulated
Amortization
Net
Carrying
Amount
Goodwill
PBM(1)
$ 29,369.8
$ (107.4)
$ 29,262.4
$ 5,512.6
$ (107.4)
$ 5,405.2
Other Business Operations(1)
97.4
-
97.4
80.5
-
80.5
$ 29,467.2
$ (107.4)
$ 29,359.8
$ 5,593.1
$ (107.4)
$ 5,485.7
Other intangible assets
PBM
Customer contracts
$ 17,672.7
$ (2,038.3)
$ 15,634.4
$ 2,018.5
$ (494.7)
$ 1,523.8
Trade names
226.6
(16.7)
209.9
3.6
-
3.6
Miscellaneous
121.6
(34.9)
86.7
123.0
(60.1)
62.9
18,020.9
(2,089.9)
15,931.0
2,145.1
(554.8)
1,590.3
Other Business Operations
Customer relationships
138.5
(63.2)
75.3
68.4
(38.5)
29.9
Trade names
34.7
(3.1)
31.6
0.7
-
0.7
173.2
(66.3)
106.9
69.1
(38.5)
30.6
Total other intangible assets
$ 18,194.1
$ (2,156.2)
$ 16,037.9
$ 2,214.2
$ (593.3)
$ 1,620.9
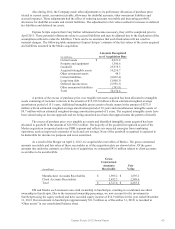
(1) Goodwill associated with the Medco acquisition has been reallocated between the PBM and the Other Business Operations segments
due to refinement of purchase price valuation assumptions. $1,253.9 million previously allocated to the Other Business Operations
segment as of June 30, 2012 was reallocated to the PBM as of December 31, 2012.
The change in the net carrying value of goodwill by business segment is shown in the following table:
(in millions)
PBM
Other
Business
Operations
(1)
Total
Balance at December 31, 2010
$
5,405.7
$
80.5
$
5,486.2
Foreign currency translation and other
(0.5)
-
(0.5)
Balance at December 31, 2011
$
5,405.2
$
80.5
$
5,485.7
Acquisitions(1)(2)
23,856.5
121.8
23,978.3
Discontinued operations(3)
-
(88.5)
(88.5)
Dispositions(4)
-
(14.0)
(14.0)
Foreign currency translation
0.7
(2.4)
(1.7)
Balance at December 31, 2012
$
29,262.4
$
97.4
$
29,359.8
(1) Goodwill associated with the Medco acquisition has been reallocated between the PBM and the Other Business Operations segments
due to refinement of purchase price valuation assumptions. $1,253.9 million previously allocated to the Other Business Operations
segment as of June 30, 2012 was reallocated to PBM as of December 31, 2012.
(2) Represents the acquisition of Medco in April 2012.
(3) Represents goodwill associated with UBC.
(4) Represents the disposition of $12.0 million of goodwill associated with the sale of CYC and the impairment of $2.0 million
associated with EAV.
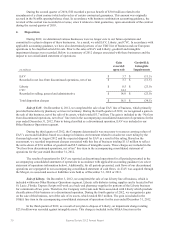
The aggregate amount of amortization expense of other intangible assets for our continuing operations was
$1,632.0 million, $236.0 million and $159.8 million for the years ended December 31, 2012, 2011 and 2010,
respectively. Amortization expense for the years ended December 31, 2012 and 2011 includes $43.6 million and
$81.0 million, respectively, of fees incurred, recorded in interest expense in the consolidated statement of
operations, related to the termination or partial termination of bridge loan financing in connection with business
combinations in process during each respective period. Additionally, in accordance with applicable accounting