Express Scripts 2012 Annual Report Download - page 59
Download and view the complete annual report
Please find page 59 of the 2012 Express Scripts annual report below. You can navigate through the pages in the report by either clicking on the pages listed below, or by using the keyword search tool below to find specific information within the annual report.-
 1
1 -
2
-
3
-
4
-
5
-
6
-
7
-
8
-
9
-
10
-
11
-
12
-
13
-
14
-
15
-
16
-
17
-
18
-
19
-
20
-
21
-
22
-
23
-
24
-
25
-
26
-
27
-
28
-
29
-
30
-
31
-
32
-
33
-
34
-
35
-
36
-
37
-
38
-
39
-
40
-
41
-
42
-
43
-
44
-
45
-
46
-
47
-
48
-
 49
49 -
 50
50 -
 51
51 -
 52
52 -
 53
53 -
 54
54 -
 55
55 -
 56
56 -
 57
57 -
 58
58 -
 59
59 -
 60
60 -
 61
61 -
 62
62 -
 63
63 -
 64
64 -
 65
65 -
 66
66 -
 67
67 -
 68
68 -
 69
69 -
70
-
71
-
72
-
73
-
74
-
75
-
76
-
77
-
78
-
79
-
80
-
81
-
82
-
83
-
84
-
85
-
86
-
87
-
88
-
89
-
90
-
91
-
92
-
93
-
94
-
95
-
96
-
97
-
98
-
99
-
100
-
101
-
102
-
103
-
104
-
105
-
106
-
107
-
108
-
109
-
110
-
111
-
112
-
113
-
114
-
115
-
116
-
117
-
118
-
119
-
120
 |
 |

Express Scripts 2012 Annual Report 57
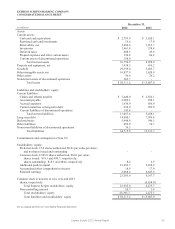
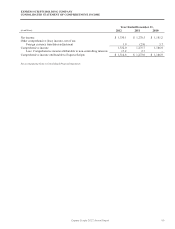
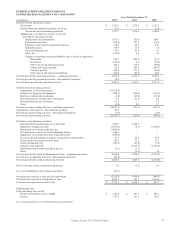
EXPRESS SCRIPTS HOLDING COMPANY
CONSOLIDATED STATEMENT OF CASH FLOWS
Year Ended December 31,
(in millions)
2012
2011
2010
Cash flows from operating activities:
Net income
$ 1,330.1
$ 1,278.5
$ 1,181.2
Net loss from discontinued operations, net of tax
27.6
-
23.4
Net income from continuing operations
1,357.7
1,278.5
1,204.6
Adjustments to reconcile net income to net cash
provided by operating activities:
Depreciation and amortization
1,872.6
253.4
244.7
Deferred income taxes
(390.4)
137.8
110.4
Employee stock-based compensation expense
410.0
48.8
49.7
Bad debt expense
158.8
11.6
5.2
Deferred financing fees
43.6
81.0
5.1
Other, net
(118.5)
4.5
9.4
Changes in operating assets and liabilities, net of effects of acquisition:
Receivables
325.2
(206.1)
793.0
Inventories
(515.8)
8.0
(70.2)
Other current and noncurrent assets
303.2
119.2
(90.0)
Claims and rebates payable
82.8
207.5
(186.7)
Accounts payable
982.2
271.4
(50.4)
Other current and noncurrent liabilities
240.8
(22.5)
80.3
Net cash provided by operating activities—continuing operations
4,752.2
2,193.1
2,105.1
Net cash provided by operating activities—discontinued operations
29.4
-
12.3
Net cash flows provided by operating activities
4,781.6
2,193.1
2,117.4
Cash flows from investing activities:
Acquisitions, net of cash acquired
( 10,326.4)
-
-
Purchases of property and equipment
(160.2)
(144.4)
(119.9)
Purchase of short-term investments
(2.8)
(25.0)
(38.0)
Proceeds from sale of short-term investments
4.6
45.0
8.6
Proceeds from the sale of business
61.5
-
2.5
Other
(5.8)
0.5
1.7
Net cash used in investing activities—continuing operations
(10,429.1)
(123.9)
(145.1)
Acquisitions, cash acquired – discontinued operations
42.8
-
-
Net cash used in investing activities—discontinued operations
(5.4)
-
(0.8)
Net cash used in investing activities
(10,391.7)
(123.9)
(145.9)
Cash flows from financing activities:
Proceeds from long-term debt, net of discounts
7,458.9
5,580.3
-
Repayment of long-term debt
(3,868.5)
(0.1)
(1,340.1)
Repayment of revolving credit line, net
(1,000.0)
-
-
Proceeds from accounts receivable financing facility
600.0
-
-
Repayment of accounts receivable financing facility
(600.0)
-
-
Excess tax benefit relating to employee stock-based compensation
45.3
28.3
58.9
Net proceeds from employee stock plans
326.0
32.2
35.3
Deferred financing fees
(103.2)
(91.6)
(3.9)
Treasury stock acquired
-
(2,515.7)
(1,276.2)
Distributions paid to non-controlling interest
(8.1)
(1.1)
-
Other
-
(2.9)
3.0
Net cash provided by (used in) financing activities—continuing operations
2,850.4
3,029.4
(2,523.0)
Net cash used in financing activities—discontinued operations
(26.8)
-
-
Net cash provided by (used in) financing activities
2,823.6
3,029.4
(2,523.0)
Effect of foreign currency translation adjustment
2.0
(2.2)
4.8
Less cash attributable to discontinued operations
(41.7)
-
-
Net (decrease) increase in cash and cash equivalents
(2,826.2)
5,096.4
(546.7)
Cash and cash equivalents at beginning of year
5,620.1
523.7
1,070.4
Cash and cash equivalents at end of year
$ 2,793.9
$ 5,620.1
$ 523.7
Supplemental data:
Cash paid during the year for:
Income tax payments, net of refunds
$ 1,164.2
$ 487.3
$ 601.4
Interest
587.3
181.6
162.3
See accompanying Notes to Consolidated Financial Statements