Express Scripts 2012 Annual Report Download - page 48
Download and view the complete annual report
Please find page 48 of the 2012 Express Scripts annual report below. You can navigate through the pages in the report by either clicking on the pages listed below, or by using the keyword search tool below to find specific information within the annual report.-
 1
1 -
2
-
3
-
4
-
5
-
6
-
7
-
8
-
9
-
10
-
11
-
12
-
13
-
14
-
15
-
16
-
17
-
18
-
19
-
20
-
21
-
22
-
23
-
24
-
25
-
26
-
27
-
28
-
29
-
30
-
31
-
32
-
33
-
34
-
35
-
36
-
37
-
 38
38 -
 39
39 -
 40
40 -
 41
41 -
 42
42 -
 43
43 -
 44
44 -
 45
45 -
 46
46 -
 47
47 -
 48
48 -
 49
49 -
 50
50 -
 51
51 -
 52
52 -
 53
53 -
 54
54 -
 55
55 -
 56
56 -
 57
57 -
 58
58 -
59
-
60
-
61
-
62
-
63
-
64
-
65
-
66
-
67
-
68
-
69
-
70
-
71
-
72
-
73
-
74
-
75
-
76
-
77
-
78
-
79
-
80
-
81
-
82
-
83
-
84
-
85
-
86
-
87
-
88
-
89
-
90
-
91
-
92
-
93
-
94
-
95
-
96
-
97
-
98
-
99
-
100
-
101
-
102
-
103
-
104
-
105
-
106
-
107
-
108
-
109
-
110
-
111
-
112
-
113
-
114
-
115
-
116
-
117
-
118
-
119
-
120
 |
 |
Express Scripts 2012 Annual Report46
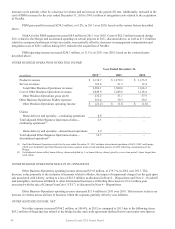
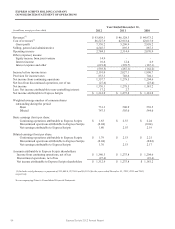
NET INCOME AND EARNINGS PER SHARE ATTRIBUTABLE TO EXPRESS SCRIPTS
Net income increased $37.1 million, or 2.9%, for the year ended December 31, 2012 over 2011 and increased
$94.6 million, or 8.0%, for the year ended December 31, 2011 over 2010.
Basic and diluted earnings per share decreased 29.4% and 30.4%, respectively, for the year ended December 31,
2012 over 2011. The decrease is primarily due to amortization of intangibles and integration costs, offset by the addition of
Medco operating results, improved operating performance and synergies. Basic and diluted earnings per share increased
16.4% and 16.6%, respectively for the year ended December 31, 2011 over 2010. The increase is primarily due to operating
results, as well as the repurchase of 46.4 million treasury shares during 2011.
LIQUIDITY AND CAPITAL RESOURCES
OPERATING CASH FLOW AND CAPITAL EXPENDITURES
In 2012, net cash provided by continuing operations increased $2,559.1 million to $4,752.2 million. Changes in
operating cash flows from continuing operations in 2012 were impacted by the following factors:
Net income from continuing operations increased $79.2 million in 2012 over 2011. This increase was offset
primarily by amortization of intangibles acquired in the Merger. Total depreciation and amortization expense was
$1,872.6 million in 2012, an increase of $1,619.2 million over 2011. These charges have been added back to cash
flow from operating activities to reconcile net income to net cash provided.
Changes in working capital resulted in cash inflows of $1,418.4 million in 2012 compared to cash inflows of
$377.5 million over the same period in 2011, resulting in a total increase of $1,040.9 million. The cash flow
increase was primarily due the timing and receipt and payment of claims payable, accounts receivable and
accounts payable as well as the realization of working capital synergies.
In 2012, net cash provided by discontinued operations increased $29.4 million. This was due to classification of
EAV, UBC and Europe as discontinued operations in 2012, while no businesses were classified as discontinued operations
in 2011.
In 2011, net cash provided by continuing operations increased $88.0 million to $2,193.1 million. Changes in
operating cash flows from continuing operations in 2011 were impacted by the following factors:
Net income from continuing operations increased $73.9 million in 2011 over 2010. This increase was partially
reduced by the expensing of deferred financing fees in 2011, which included charges of $81.0 million related
primarily to the bridge loan for the financing of the Merger. These charges have been added back to cash flows
from operating activities to reconcile net income to net cash provided.
The deferred tax provision increased $27.4 million in 2011 compared to 2010, which reflected a net change in
taxable temporary differences primarily attributable to tax deductible goodwill associated with the NextRx
acquisition.
Changes in working capital resulted in cash inflows of $377.5 million in 2011 compared to cash inflows of
$476.0 million over the same period in 2010, resulting in a total decrease of $98.5 million. The cash flow decrease
was primarily related to the strong cash flow in 2010 as a result of the collection of receivables from
pharmaceutical manufacturers and clients due to the acquisition of NextRx.
Net cash provided by operating activities also includes outflows related to transaction fees incurred in connection
with the Merger.
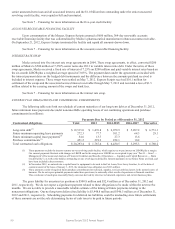
As a percent of accounts receivable, our allowance for doubtful accounts for continuing operations was 2.8% and
2.9% at December 31, 2012 and 2011, respectively.
In 2012, net cash used in investing activities by continuing operations increased $10,305.2 million over 2011
primarily due to the Merger offset slightly by cash inflows due to the sale of Liberty and CYC. In the fourth quarter of
2011, ESI opened a new office facility in St. Louis, Missouri to consolidate our St. Louis presence onto our Headquarters
campus. Capital expenditures of approximately $32.0 million and other costs of approximately $1.3 million related to this
facility were incurred in 2011.