Express Scripts 2012 Annual Report Download - page 45
Download and view the complete annual report
Please find page 45 of the 2012 Express Scripts annual report below. You can navigate through the pages in the report by either clicking on the pages listed below, or by using the keyword search tool below to find specific information within the annual report.-
 1
1 -
2
-
3
-
4
-
5
-
6
-
7
-
8
-
9
-
10
-
11
-
12
-
13
-
14
-
15
-
16
-
17
-
18
-
19
-
20
-
21
-
22
-
23
-
24
-
25
-
26
-
27
-
28
-
29
-
30
-
31
-
32
-
33
-
34
-
 35
35 -
 36
36 -
 37
37 -
 38
38 -
 39
39 -
 40
40 -
 41
41 -
 42
42 -
 43
43 -
 44
44 -
 45
45 -
 46
46 -
 47
47 -
 48
48 -
 49
49 -
 50
50 -
 51
51 -
 52
52 -
 53
53 -
 54
54 -
 55
55 -
56
-
57
-
58
-
59
-
60
-
61
-
62
-
63
-
64
-
65
-
66
-
67
-
68
-
69
-
70
-
71
-
72
-
73
-
74
-
75
-
76
-
77
-
78
-
79
-
80
-
81
-
82
-
83
-
84
-
85
-
86
-
87
-
88
-
89
-
90
-
91
-
92
-
93
-
94
-
95
-
96
-
97
-
98
-
99
-
100
-
101
-
102
-
103
-
104
-
105
-
106
-
107
-
108
-
109
-
110
-
111
-
112
-
113
-
114
-
115
-
116
-
117
-
118
-
119
-
120
 |
 |
Express Scripts 2012 Annual Report 43
765.5 007.3 147.8
es(3) 004.7 547.4 .2
805.8 273.0 260.9
576.0 827.7 .9
478.0 668.9 886.6
.0 158.8 20.3
292.3 856.2 .8
805.7 302.6 .5
020.7 600.4 602.0
128.3 53.4 54.1
.0 653.8 656.1
.2 751.5 753.9
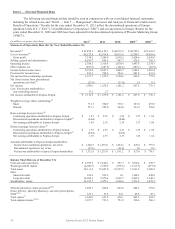
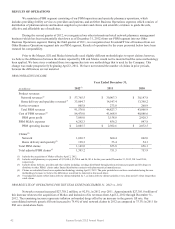
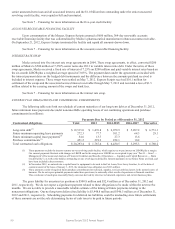
Home delivery and specialty revenues increased $18,457.3 million, or 126.9%, in 2012 over 2011. Approximately
$16,952.3 million of this increase relates to the acquisition of Medco and inclusion of its revenues from April 2, 2012
through December 31, 2012. The remaining increase represents inflation on branded drugs and higher claims volumes
attributed to the success of mail conversion programs offset by an increase in the generic fill rate. Our consolidated home
delivery generic fill rate increased to 71.5% of home delivery claims in 2012 as compared to 63.0% in the same period of
2011 for ESI on a stand-alone basis. The home delivery generic fill rate is lower than the retail generic fill rate as fewer
generic substitutions are available among maintenance medications (e.g., therapies for chronic conditions) commonly
dispensed from home delivery pharmacies compared to acute medications which are primarily dispensed by pharmacies in
our retail networks.
Total revenue for the year ended December 31, 2011 also included charges of $30.0 million related to a client
contractual dispute. This dispute has since been resolved and the impact of the resolution is not material. See Note 12 –
Commitments and contingencies for further discussion of this contractual dispute.
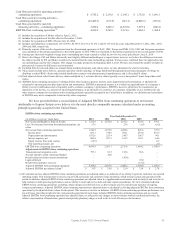
Cost of PBM revenues increased $42,809.1 million, or 102.7%, in 2012 when compared to the same period of
2011. Approximately $41,260.2 million of this increase relates to the acquisition of Medco and inclusion of its costs from
April 2, 2012 through December 31, 2012. The increase during the period is also due to ingredient cost inflation partially
offset by an increase in the generic fill rate. Additionally, included in the cost of PBM revenues for the year ended
December 31, 2012 is $49.7 million of integration costs related to the acquisition of Medco.
PBM gross profit increased $3,939.2 million, or 124.7%, in 2012 over 2011. Approximately $3,422.0 million of
this increase relates to the acquisition of Medco and inclusion of its costs from April 2, 2012 through December 31, 2012.
The remaining increase primarily relates to better management of ingredient costs and cost savings from the increase in the
aggregate generic fill rate.
Selling, general and administrative expense (“SG&A”) for the PBM segment increased $3,436.1 million, or
401.3% in 2012 over 2011. Approximately $2,497.1 million of this increase relates to the acquisition of Medco and
inclusion of its SG&A from April 2, 2012 through December 31, 2012. The remaining increase primarily relates to
management incentive compensation reflecting improved financial results and $697.2 million of transaction and integration
costs for the combined Company. These increases are offset by synergies realized following the Merger.
PBM operating income increased $503.1 million, or 21.8%, in 2012 over 2011, based on the various factors
described above.
PBM RESULTS OF OPERATIONS FOR THE YEAR ENDED DECEMBER 31, 2011 vs. 2010
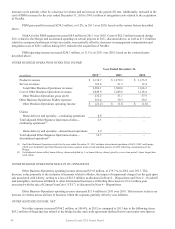
Network revenues decreased $140.5 million, or 0.5%, in 2011 over 2010. Approximately $455.6 million of this
decrease is due to lower U.S. claims volume. Additionally, our network generic fill rate increased to 75.3% of total network
claims in 2011 as compared to 72.7% in 2010. The decrease in volume and increase in the generic fill rate are partially
offset by the pricing impacts related to inflation. An additional $30.0 million of the decrease relates to amounts recorded in
the second quarter of 2010 related to the amendment of a client contract which relieved us of certain contractual guarantees.
Network claims include U.S. and Canadian claims. Network claims decreased slightly in 2011 compared to 2010.
A decrease in U.S. network claim volume was partially offset by an increase in Canadian claim volume. Revenue related to
Canadian claims represents administrative fees received for processing claims and is reflected in service revenues.
Home delivery and specialty revenues increased $1,149.2 million, or 8.6%, in 2011 over 2010. These increases
were partially offset by the impact of higher generic penetration as our generic penetration rate increased to 63.0% of home
delivery claims in 2011 compared to 60.2% in 2010. The home delivery generic fill rate is lower than the retail generic fill
rate as fewer generic substitutions are available among maintenance medications (e.g., therapies for chronic conditions)
commonly dispensed from home delivery pharmacies compared to acute medications which are primarily dispensed by
pharmacies in our retail networks.
Total revenue for the year ended December 31, 2011 also includes charges of $30.0 million related to a client
contractual dispute. This dispute has since been resolved and the impact of the resolution is not material. See Note 12 –
Commitments and contingencies for further discussion of this contract dispute.
Cost of PBM revenues increased $782.3 million, or 1.9%, in 2011 when compared to the same period in 2010. The
increase during the period is due primarily to ingredient cost inflation as well as accelerated spending on certain projects in
2011 in order to create additional capacity to successfully complete integration activities for the Merger in 2012. These