Express Scripts 2012 Annual Report Download - page 37
Download and view the complete annual report
Please find page 37 of the 2012 Express Scripts annual report below. You can navigate through the pages in the report by either clicking on the pages listed below, or by using the keyword search tool below to find specific information within the annual report.-
 1
1 -
2
-
3
-
4
-
5
-
6
-
7
-
8
-
9
-
10
-
11
-
12
-
13
-
14
-
15
-
16
-
17
-
18
-
19
-
20
-
21
-
22
-
23
-
24
-
25
-
26
-
 27
27 -
 28
28 -
 29
29 -
 30
30 -
 31
31 -
 32
32 -
 33
33 -
 34
34 -
 35
35 -
 36
36 -
 37
37 -
 38
38 -
 39
39 -
 40
40 -
 41
41 -
 42
42 -
 43
43 -
 44
44 -
 45
45 -
 46
46 -
 47
47 -
48
-
49
-
50
-
51
-
52
-
53
-
54
-
55
-
56
-
57
-
58
-
59
-
60
-
61
-
62
-
63
-
64
-
65
-
66
-
67
-
68
-
69
-
70
-
71
-
72
-
73
-
74
-
75
-
76
-
77
-
78
-
79
-
80
-
81
-
82
-
83
-
84
-
85
-
86
-
87
-
88
-
89
-
90
-
91
-
92
-
93
-
94
-
95
-
96
-
97
-
98
-
99
-
100
-
101
-
102
-
103
-
104
-
105
-
106
-
107
-
108
-
109
-
110
-
111
-
112
-
113
-
114
-
115
-
116
-
117
-
118
-
119
-
120
 |
 |

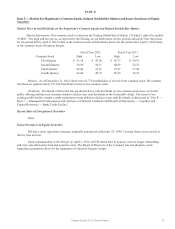
Express Scripts 2012 Annual Report 35
858.1 128.3 973.2 722.3 941.2
27.9 918.4 15.0 298.3 910.6
30.2 209.9 58.2 424.0 030.6
45.7 895.5 87.3 926.5 56.3
84.5 314.4 .9 497.5 274.3
593.5) 87.3) 162.2) 189.1) 66.9)
191.0 027.1 .7 .4 207.4
833.3 8.6 704.1 481.8 431.5
.7 8.5 204.6 826.6 775.9
27.6) - 23.4) 1.0 0.2
30.1 8.5 181.2 827.6 776.1
17.2 2.7 - - -
12.9 5.8 181.2 827.6 776.1
731.3 500.9 538.5 527.0 497.8
747.3 5.0 544.0 532.2 503.6
1.83 55 2.24 1.57 56
.04) - 04) - -
1.80 55 2.19 1.57 56
1.79 .53 2.21 1.55 54
.04) - 04) - -
1.76 .53 2.17 1.56 54
340.5 .8 204.6 826.6 775.9
27.6) - 23.4) 1.0 0.2
12.9 .8 181.2 827.6 776.1
793.9 620.1 .7 070.4 530.7
00.5) 9.9 975.9) 313.3) 677.9)
111.2 607.0 557.8 931.2 509.2
934.9 999.9 .1 340.1 420.0
980.1 076.4 493.7 492.5 340.3
395.7 475.3 606.6 551.8 078.2
020.7 600.4 602.0 404.3 379.6
.8 653.8 656.1 449.3 424.7
.7 751.5 753.9 530.6 506.3
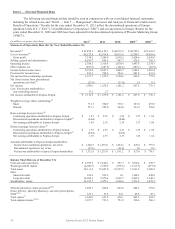
Cash flows provided by operating activities—
continuing operations
$ 4,752.2
$ 2,193.1
$ 2,105.1
$ 1,752.0
$ 1,091.1
Cash flows used in investing activities—
continuing operations
(10,429.1)
(123.9)
(145.1)
(4,820.5)
(318.6)
Cash flows provided by (used in)
financing activities—continuing operations
2,850.4
3,029.4
(2,523.0)
3,587.0
(680.4)
EBITDA from continuing operations(11)
4,639.9
2,565.1
2,315.6
1,604.2
1,368.4
(1) Includes the acquisition of Medco effective April 2, 2012.
(2) Includes the acquisition of NextRx effective December 1, 2009.
(3) Includes the acquisition of MSC effective July 22, 2008.
(4) Includes retail pharmacy co-payments of $11,668.6, $5,786.6, $6,181.4, $3,132.1 and $3,153.6 for the years ended December 31, 2012, 2011, 2010,
2009 and 2008, respectively.
(5) Primarily consists of the results of operations from the discontinued operations of EAV, UBC, Europe and PMG. EAV, UBC and European operations
were classified as discontinued operations in the fourth quarter of 2012. PMG was classified as discontinued operations in the second quarter of 2010.
(6) Earnings per share and weighted-average shares outstanding have been restated to reflect the two-for-one stock split effective June 8, 2010.
(7) Prior to the Merger, ESI and Medco historically used slightly different methodologies to report claims; however, we believe the differences between
the claims reported by ESI and Medco would not be material had the same methodology applied. We have since combined these two approaches into
one methodology used by the Company. This change was made prospectively beginning April 2, 2012. We have not restated the number of claims in
prior periods, because the differences are not material.
(8) Excluded from the network claims are manual claims and drug formulary only claims where we only administer the client’s formulary.
(9) These claims include home delivery, specialty and other claims including: (a) drugs distributed through patient assistance programs; (b) drugs we
distribute to other PBMs’ clients under limited distribution contracts with pharmaceutical manufacturers; and (c) FreedomFP claims.
(10) Total adjusted claims reflect home delivery claims multiplied by 3, as home delivery claims typically cover a time period 3 times longer than retail
claims.
(11) EBITDA from continuing operations is earnings before other income (expense), interest, taxes, depreciation and amortization, or alternatively
calculated as operating income plus depreciation and amortization. EBITDA is presented because it is a widely accepted indicator of a company’s
ability to service indebtedness and is frequently used to evaluate a company’s performance. EBITDA, however, should not be considered as an
alternative to net income, as a measure of operating performance, as an alternative to cash flow, as a measure of liquidity or as a substitute for any
other measure computed in accordance with accounting principles generally accepted in the United States. In addition, our definition and calculation
of EBITDA may not be comparable to that used by other companies.
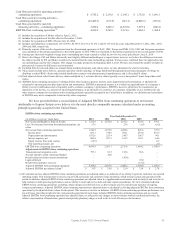
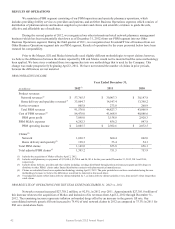
We have provided below a reconciliation of Adjusted EBITDA from continuing operations to net income
attributable to Express Scripts as we believe it is the most directly comparable measure calculated under accounting
principles generally accepted in the United States:
EBITDA from continuing operations
Year Ended December 31,
(in millions, except per claim data)
2012
2011
2010
2009
2008
Net income attributable to Express Scripts
$ 1,312.9
$ 1,275.8
$ 1,181.2
$ 827.6
$ 776.1
Less: Net (income) loss from discontinued operations, net
of tax
27.6
-
23.4
(1.0)
(0.2)
Net income from continuing operations
1,340.5
1,275.8
1,204.6
826.6
775.9
Income taxes
833.3
748.6
704.1
481.8
431.5
Depreciation and amortization
1,872.6
253.4
244.7
106.7
94.1
Interest expense, net
608.4
287.3
162.2
189.1
64.6
Equity income from joint venture
(14.9)
-
-
-
0.3
Non-operating charges, net
-
-
-
-
2.0
EBITDA from continuing operations
4,639.9
2,565.1
2,315.6
1,604.2
1,368.4
Adjustments to EBITDA from continuing operations
Transaction and integration costs
755.1
62.5
122.6
68.6
-
Accrual related to client contractual dispute
-
30.0
-
-
-
Benefit related to client contract amendment
-
-
(30.0)
-
-
Legal settlement
-
-
-
35.0
-
Benefit from insurance recovery
-
-
-
(15.0)
-
Adjusted EBITDA from continuing operations
5,395.0
2,657.6
2,408.2
1,692.8
1,368.4
Adjusted EBITDA per adjusted claim(1)
$ 3.87
$ 3.54
$ 3.19
$ 3.19
$ 2.70
(1) We calculate and use adjusted EBITDA from continuing operations per adjusted claim as an indicator of our ability to generate cash from our reported
operating results. This measurement is used in concert with net income and cash flows from operations, which measure actual cash generated in the
period. In addition, adjusted EBITDA from continuing operations per adjusted claim is a supplemental measurement used by analysts and investors to
help evaluate overall operating performance and our ability to incur and service debt and make capital expenditures. We have calculated adjusted
EBITDA from continuing operations excluding certain charges recorded each year, as these charges are not considered an indicator of ongoing
company performance. Adjusted EBITDA from continuing operations per adjusted claim is calculated by dividing adjusted EBITDA from continuing
operations by the adjusted claim volume for the period. This measure is used as an indicator of EBITDA from continuing operations performance on a
per-unit basis, providing insight into the cash-generating potential of each claim. Adjusted EBITDA from continuing operations and, as a result,
adjusted EBITDA from continuing operations per adjusted claim, are affected by the changes in claim volumes between retail and mail-order, the
relative representation of brand-name, generic and specialty pharmacy drugs, as well as the level of efficiency in the business.