Express Scripts 2012 Annual Report Download - page 44
Download and view the complete annual report
Please find page 44 of the 2012 Express Scripts annual report below. You can navigate through the pages in the report by either clicking on the pages listed below, or by using the keyword search tool below to find specific information within the annual report.-
 1
1 -
2
-
3
-
4
-
5
-
6
-
7
-
8
-
9
-
10
-
11
-
12
-
13
-
14
-
15
-
16
-
17
-
18
-
19
-
20
-
21
-
22
-
23
-
24
-
25
-
26
-
27
-
28
-
29
-
30
-
31
-
32
-
33
-
 34
34 -
 35
35 -
 36
36 -
 37
37 -
 38
38 -
 39
39 -
 40
40 -
 41
41 -
 42
42 -
 43
43 -
 44
44 -
 45
45 -
 46
46 -
 47
47 -
 48
48 -
 49
49 -
 50
50 -
 51
51 -
 52
52 -
 53
53 -
 54
54 -
55
-
56
-
57
-
58
-
59
-
60
-
61
-
62
-
63
-
64
-
65
-
66
-
67
-
68
-
69
-
70
-
71
-
72
-
73
-
74
-
75
-
76
-
77
-
78
-
79
-
80
-
81
-
82
-
83
-
84
-
85
-
86
-
87
-
88
-
89
-
90
-
91
-
92
-
93
-
94
-
95
-
96
-
97
-
98
-
99
-
100
-
101
-
102
-
103
-
104
-
105
-
106
-
107
-
108
-
109
-
110
-
111
-
112
-
113
-
114
-
115
-
116
-
117
-
118
-
119
-
120
 |
 |

Express Scripts 2012 Annual Report42
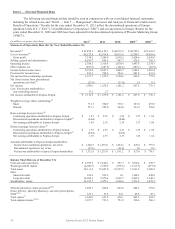
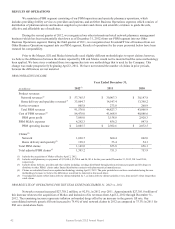
RESULTS OF OPERATIONS
We maintain a PBM segment consisting of our PBM operations and specialty pharmacy operations, which
includes providing fertility services to providers and patients, and an Other Business Operations segment, which consists of
distribution of pharmaceuticals and medical supplies to providers and clinics and scientific evidence to guide the safe,
effective and affordable use of medicines.
During the second quarter of 2012, we reorganized our other international retail network pharmacy management
business (which has been substantially shut down as of December 31, 2012) from our PBM segment into our Other
Business Operations segment. During the third quarter of 2011, we reorganized our FreedomFP line of business from our
Other Business Operations segment into our PBM segment. Results of operations for the years presented below have been
restated for comparability.
Prior to the Merger, ESI and Medco historically used slightly different methodologies to report claims; however,
we believe the differences between the claims reported by ESI and Medco would not be material had the same methodology
been applied. We have since combined these two approaches into one methodology that is used by the Company. This
change was made prospectively beginning April 2, 2012. We have not restated the number of claims in prior periods,
because the differences are not material.
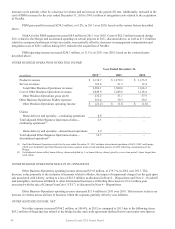
PBM OPERATING INCOME
Year Ended December 31,
(in millions)
2012
(1)
2011
2010
Product revenues:
Network revenues(2)
$ 57,765.5
$ 30,007.3
$ 30,147.8
Home delivery and specialty revenues(3)
33,004.7
14,547.4
13,398.2
Service revenues
805.8
273.0
260.9
Total PBM revenues
91,576.0
44,827.7
43,806.9
Cost of PBM revenues(2)
84,478.0
41,668.9
40,886.6
PBM gross profit
7,098.0
3,158.8
2,920.3
PBM SG&A expenses
4,292.3
856.2
847.8
PBM operating income
$ 2,805.7
$ 2,302.6
$ 2,072.5
Claims(4)
Network
1,020.7
600.4
602.0
Home delivery and specialty(3)
128.3
53.4
54.1
Total PBM claims
1,149.0
653.8
656.1
Total adjusted PBM claims(5)
1,393.2
751.5
753.9
(1) Includes the acquisition of Medco effective April 2, 2012.
(2) Includes retail pharmacy co-payments of $11,668.6, $5,786.6 and $6,181.4 for the years ended December 31, 2012, 2011 and 2010,
respectively.
(3) Includes home delivery, specialty and other claims including: (a) drugs distributed through patient assistance programs and (b) drugs we
distribute to other PBMs’ clients under limited distribution contracts with pharmaceutical manufacturers.
(4) Claims are calculated based on an updated methodology starting April 2, 2012. The prior periods have not been recalculated using the new
methodology because we believe the differences would not be material, as discussed above.
(5) Total adjusted claims reflect home delivery claims multiplied by 3, as home delivery claims typically cover a time period 3 times longer than
retail claims.
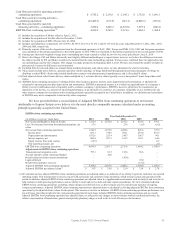
PBM RESULTS OF OPERATIONS FOR THE YEAR ENDED DECEMBER 31, 2012 vs. 2011
Network revenues increased $27,758.2 million, or 92.5%, in 2012 over 2011. Approximately $27,381.0 million of
this increase relates to the acquisition of Medco and inclusion of its revenues from April 2, 2012 through December 31,
2012. The remaining increase represents inflation on branded drugs offset by an increase in the generic fill rate. Our
consolidated network generic fill rate increased to 79.4% of total network claims in 2012 as compared to 75.3% in 2011 for
ESI on a stand-alone basis.