Express Scripts 2012 Annual Report Download - page 63
Download and view the complete annual report
Please find page 63 of the 2012 Express Scripts annual report below. You can navigate through the pages in the report by either clicking on the pages listed below, or by using the keyword search tool below to find specific information within the annual report.-
 1
1 -
2
-
3
-
4
-
5
-
6
-
7
-
8
-
9
-
10
-
11
-
12
-
13
-
14
-
15
-
16
-
17
-
18
-
19
-
20
-
21
-
22
-
23
-
24
-
25
-
26
-
27
-
28
-
29
-
30
-
31
-
32
-
33
-
34
-
35
-
36
-
37
-
38
-
39
-
40
-
41
-
42
-
43
-
44
-
45
-
46
-
47
-
48
-
49
-
50
-
51
-
52
-
 53
53 -
 54
54 -
 55
55 -
 56
56 -
 57
57 -
 58
58 -
 59
59 -
 60
60 -
 61
61 -
 62
62 -
 63
63 -
 64
64 -
 65
65 -
 66
66 -
 67
67 -
 68
68 -
 69
69 -
 70
70 -
 71
71 -
 72
72 -
 73
73 -
74
-
75
-
76
-
77
-
78
-
79
-
80
-
81
-
82
-
83
-
84
-
85
-
86
-
87
-
88
-
89
-
90
-
91
-
92
-
93
-
94
-
95
-
96
-
97
-
98
-
99
-
100
-
101
-
102
-
103
-
104
-
105
-
106
-
107
-
108
-
109
-
110
-
111
-
112
-
113
-
114
-
115
-
116
-
117
-
118
-
119
-
120
 |
 |
Express Scripts 2012 Annual Report 61
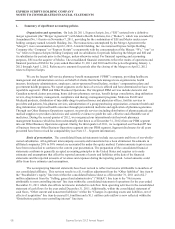
the segment level. Our reporting units represent businesses for which discrete financial information is available and
reviewed regularly by segment management. The implied fair value of goodwill would be determined in Step 2, if
necessary, based on the fair value of the individual assets and liabilities of the reporting unit, using discount rates
that reflect the inherent risk of the underlying business. We would record an impairment charge to the extent the
carrying value of goodwill exceeds the implied fair value of goodwill resulting from this calculation. This valuation
process involves assumptions based upon management’s best estimates and judgments that approximate the market
conditions experienced for our reporting units at the time the impairment assessment is made. These assumptions
include, but are not limited to, earnings and cash flow projections, discount rate and peer company comparability.
Actual results may differ from these estimates due to the inherent uncertainty involved in such estimates.
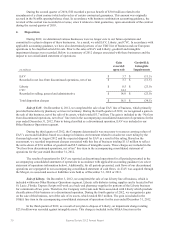
Due to the significant level of change this fiscal year as a result of the Merger, we did not perform a
qualitative assessment for any of our reporting units, and instead began with Step 1 of the goodwill impairment
analysis. No impairment existed for any of our reporting units at December 31, 2012 or December 31, 2011.
During the third quarter of 2012, we wrote off $2.0 million of goodwill based on a reassessment of the
carrying values of assets and liabilities within EAV’s line of business (see Note 6 – Goodwill and other intangibles).
During 2010, ESI wrote off $22.1 million of goodwill in connection with the classification of PMG as a
discontinued operation (see Note 6 – Goodwill and other intangibles).
Other intangible assets. Other intangible assets include, but are not limited to, customer contracts and
relationships, deferred financing fees and trade names. Deferred financing fees are recorded at cost. Customer
contracts and relationships are valued at fair market value when acquired using the income method. Customer
contracts and relationships related to our 10-year contract with WellPoint, Inc. (“WellPoint”) under which we
provide pharmacy benefit management services to WellPoint and its designated affiliates (“the PBM agreement”)
are being amortized using a modified pattern of benefit method over an estimated useful life of 15 years. Customer
contracts and relationships intangible assets related to our acquisition of Medco are being amortized using a
modified pattern of benefit method over an estimated useful life of 1.75 to 15.75 years, respectively. All other
intangible assets, excluding legacy ESI trade names which have an indefinite life, are amortized on a straight-line
basis, which approximates the pattern of benefit, over periods from 5 to 20 years for customer-related intangibles, 10
years for trade names and 2 to 30 years for other intangible assets (see Note 6 – Goodwill and other intangibles).
The amount of other intangible assets reported is net of accumulated amortization of $2,156.2 million and
$593.3 million at December 31, 2012 and 2011, respectively. Amortization expense for our continuing operations
for customer-related intangibles and non-compete agreements included in selling, general and administrative
expense was $1,474.4 million, $40.7 million and $40.7 million for the years ended December 31, 2012, 2011 and
2010, respectively. In accordance with applicable accounting guidance, amortization expense for customer contracts
related to the PBM agreement has been included as an offset to revenue in the amount of $114.0 million for each of
the years ended December 31, 2012, 2011 and 2010. Amortization expense for deferred financing fees included in
interest expense was $43.6 million, $81.0 million and $5.1 million in 2012, 2011 and 2010, respectively. In 2012
and 2011, these amounts include fees incurred related to the termination or partial termination of bridge loan
financing in connection with business combinations in process during each respective period.
Self-insurance accruals. We maintain insurance coverage for claims that arise in the normal course of
business. Where insurance coverage is not available, or, in our judgment, is not cost-effective, we maintain self-
insurance accruals to reduce our exposure to future legal costs, settlements and judgments. Self-insured losses are
accrued based upon estimates of the aggregate liability for the costs of uninsured claims incurred using certain
actuarial assumptions followed in the insurance industry and our historical experience (see Note 12 – Commitments
and contingencies). It is not possible to predict with certainty the outcome of these claims, and we can give no
assurances any losses, in excess of our insurance and any self-insurance accruals, will not be material.
Fair value of financial instruments. The carrying value of cash and cash equivalents, restricted cash and
investments, accounts receivable, claims and rebates payable and accounts payable approximated fair values due to
the short-term maturities of these instruments. The fair value, which approximates the carrying value, of our bank
credit facility was estimated using the current rates offered to us for debt with similar maturity (see Note 2 – Fair
value measurements).
Revenue recognition. Revenues from our PBM segment are earned by dispensing prescriptions from our
home delivery and specialty pharmacies, processing claims for prescriptions filled by retail pharmacies in our