Energizer 2011 Annual Report Download - page 85
Download and view the complete annual report
Please find page 85 of the 2011 Energizer annual report below. You can navigate through the pages in the report by either clicking on the pages listed below, or by using the keyword search tool below to find specific information within the annual report.-
 1
1 -
2
-
3
-
4
-
5
-
6
-
7
-
8
-
9
-
10
-
11
-
12
-
13
-
14
-
15
-
16
-
17
-
18
-
19
-
20
-
21
-
22
-
23
-
24
-
25
-
26
-
27
-
28
-
29
-
30
-
31
-
32
-
33
-
34
-
35
-
36
-
37
-
38
-
39
-
40
-
41
-
42
-
43
-
44
-
45
-
46
-
47
-
48
-
49
-
50
-
51
-
52
-
53
-
54
-
55
-
56
-
57
-
58
-
59
-
60
-
61
-
62
-
63
-
64
-
65
-
66
-
67
-
68
-
69
-
70
-
71
-
72
-
73
-
74
-
 75
75 -
 76
76 -
 77
77 -
 78
78 -
 79
79 -
 80
80 -
 81
81 -
 82
82 -
 83
83 -
 84
84 -
 85
85 -
 86
86 -
 87
87 -
 88
88 -
 89
89 -
 90
90 -
 91
91 -
 92
92 -
 93
93 -
 94
94 -
 95
95 -
96
-
97
-
98
-
99
-
100
-
101
-
102
-
103
-
104
 |
 |

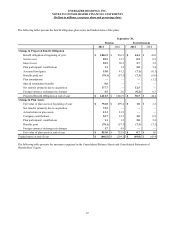
ENERGIZER HOLDINGS, INC.
(Dollars in millions, except per share and percentage data)
Derivatives designated as
Cash Flow Hedging Relationships
Foreign currency contracts
Commodity contracts
Interest rate contracts
Total
At September 30, 2010
Fair Value
Asset (Liability) (1) (2)
$ (16.8)
1.0
(7.8)
$ (23.6)
For Twelve Months Ended
September 30, 2010
Gain/(Loss)
Recognized
in OCI (3)
$ (12.3)
1.4
(11.2)
$ (22.1)
Gain/(Loss)
Reclassified From
OCI into Income
(Effective Portion) (4) (5)
$ (10.8)
7.3
—
$ (3.5)
(1) All derivative assets are presented in other current assets or other assets.
(2) All derivative liabilities are presented in other current liabilities or other liabilities.
(3) OCI is defined as other comprehensive income.
(4) Gain/(Loss) reclassified to Income was recorded as follows: Foreign currency contracts in other financing, commodity contracts in Cost of products sold.
(5) Each of these derivative instruments has a high correlation to the underlying exposure being hedged and has been deemed highly effective in offsetting
associated risk. The ineffective portion recognized in income was insignificant to the twelve months ended September 30, 2011.
(6) At September 30, 2011, $0.2 of gains associated with the Company's commodity contracts were capitalized to AOCI. The loss will be reclassified from
AOCI into income as a result of inventory being sold.
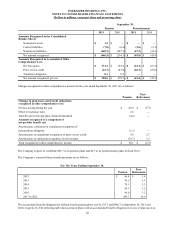
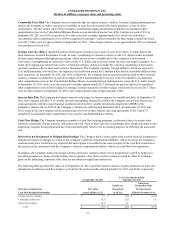
The following table provides fair values as of September 30, 2011 and 2010, and the amounts of gains and losses on derivative
instruments not classified as cash flow hedges as of and for the twelve months ended September 30, 2011 and 2010,
respectively.
Derivatives not designated as
Cash Flow Hedging Relationships
Share option
Foreign currency contracts
Total
At September 30, 2011
Fair Value
Asset (Liability)
$ (3.4)
0.4
$ (3.0)
For Twelve Months Ended
September 30, 2011
Gain/(Loss)
Recognized in Income
$ (0.6)
4.5
$ 3.9
Income Statement
Classification
SG&A
Other financing
Derivatives not designated as
Cash Flow Hedging Relationships
Share option
Foreign currency contracts
Total
At September 30, 2010
Fair Value
Asset (Liability)
$ (2.9)
2.8
$ (0.1)
For Twelve Months Ended
September 30, 2010
Gain/(Loss)
Recognized in Income
$ 0.6
(5.4)
$ (4.8)
Income Statement
Classification
SG&A
Other financing
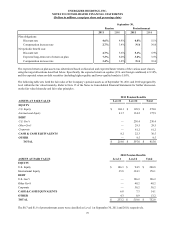
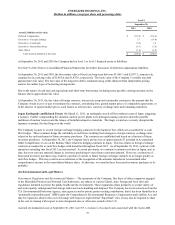
Fair Value Hierarchy Accounting guidance on fair value measurements for certain financial assets and liabilities requires that
assets and liabilities carried at fair value be classified in one of the following three categories:
Level 1: Quoted market prices in active markets for identical assets or liabilities.
Level 2: Observable market based inputs or unobservable inputs that are corroborated by market data.
Level 3: Unobservable inputs reflecting the reporting entity’s own assumptions or external inputs from inactive markets.
Under the fair value accounting guidance hierarchy, an entity is required to maximize the use of quoted market prices and
minimize the use of unobservable inputs. The following table sets forth the Company’s financial assets and liabilities, which are
carried at fair value, as of September 30, 2011 and 2010 that are measured on a recurring basis during the period, segregated by
level within the fair value hierarchy:
75