Energizer 2011 Annual Report Download - page 71
Download and view the complete annual report
Please find page 71 of the 2011 Energizer annual report below. You can navigate through the pages in the report by either clicking on the pages listed below, or by using the keyword search tool below to find specific information within the annual report.-
 1
1 -
2
-
3
-
4
-
5
-
6
-
7
-
8
-
9
-
10
-
11
-
12
-
13
-
14
-
15
-
16
-
17
-
18
-
19
-
20
-
21
-
22
-
23
-
24
-
25
-
26
-
27
-
28
-
29
-
30
-
31
-
32
-
33
-
34
-
35
-
36
-
37
-
38
-
39
-
40
-
41
-
42
-
43
-
44
-
45
-
46
-
47
-
48
-
49
-
50
-
51
-
52
-
53
-
54
-
55
-
56
-
57
-
58
-
59
-
60
-
 61
61 -
 62
62 -
 63
63 -
 64
64 -
 65
65 -
 66
66 -
 67
67 -
 68
68 -
 69
69 -
 70
70 -
 71
71 -
 72
72 -
 73
73 -
 74
74 -
 75
75 -
 76
76 -
 77
77 -
 78
78 -
 79
79 -
 80
80 -
 81
81 -
82
-
83
-
84
-
85
-
86
-
87
-
88
-
89
-
90
-
91
-
92
-
93
-
94
-
95
-
96
-
97
-
98
-
99
-
100
-
101
-
102
-
103
-
104
 |
 |

ENERGIZER HOLDINGS, INC.
NOTES TO CONSOLIDATED FINANCIAL STATEMENTS
(Dollars in millions, except per share and percentage data)
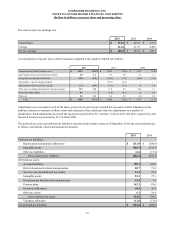
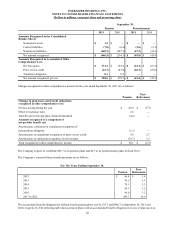
The source of pre-tax earnings was:
United States
Foreign
Pre-tax earnings
2011
$ 191.6
214.4
$ 406.0
2010
$ 225.5
317.9
$ 543.4
2009
$ 197.3
248.0
$ 445.3
A reconciliation of income taxes with the amounts computed at the statutory federal rate follows:
Computed tax at federal statutory rate
State income taxes, net of federal tax benefit
Foreign tax less than the federal rate
Tax benefits - special foreign dividend
Adjustments to prior years' tax accruals
Other taxes including repatriation of foreign earnings
Nontaxable share option
Other, net
Total
2011
$ 142.1
4.5
(15.9)
—
(1.7)
15.3
0.2
0.3
$ 144.8
35.0%
1.1
(3.9)
—
(0.4)
3.8
—
0.1
35.7%
2010
$ 190.2
5.3
(38.9)
(23.5)
(6.1)
11.0
(0.2)
2.6
$ 140.4
35.0%
1.0
(7.2)
(4.3)
(1.1)
2.0
(0.1)
0.5
25.8%
2009
$ 155.9
5.1
(28.9)
—
1.5
10.4
1.1
2.4
$ 147.5
35.0%
1.1
(6.5)
—
1.0
1.7
0.2
0.6
33.1%
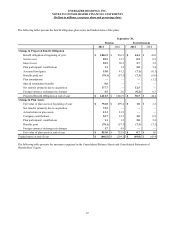
Adjustments were recorded in each of the three years to revise previously recorded tax accruals to reflect refinement of tax
attribute estimates to amounts in filed returns and settlement of tax audits and other tax adjustments in a number of
jurisdictions. Such adjustments decreased the income tax provision by $1.7 and $6.1 in fiscal 2011 and 2010, respectively, and
increased income tax provision by $1.5 in fiscal 2009.
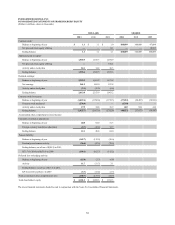
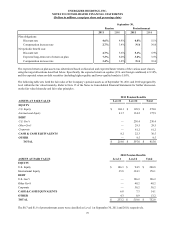
The deferred tax assets and deferred tax liabilities recorded on the balance sheet as of September 30 for the years indicated are
as follows and include current and noncurrent amounts:
Deferred tax liabilities:
Depreciation and property differences
Intangible assets
Other tax liabilities
Gross deferred tax liabilities
Deferred tax assets:
Accrued liabilities
Deferred and stock-related compensation
Tax loss carryforwards and tax credits
Intangible assets
Postretirement benefits other than pensions
Pension plans
Inventory differences
Other tax assets
Gross deferred tax assets
Valuation allowance
Net deferred tax liabilities
2011
$(112.9)
(566.7)
(6.6)
(686.2)
108.1
88.7
23.1
22.1
15.5
142.1
28.5
6.1
434.2
(12.6)
$(264.6)
2010
$(100.8)
(534.3)
(17.4)
(652.5)
125.6
71.2
23.5
27.1
7.4
83.0
26.3
10.4
374.5
(11.0)
$(289.0)
61