Energizer 2011 Annual Report Download - page 39
Download and view the complete annual report
Please find page 39 of the 2011 Energizer annual report below. You can navigate through the pages in the report by either clicking on the pages listed below, or by using the keyword search tool below to find specific information within the annual report.-
 1
1 -
2
-
3
-
4
-
5
-
6
-
7
-
8
-
9
-
10
-
11
-
12
-
13
-
14
-
15
-
16
-
17
-
18
-
19
-
20
-
21
-
22
-
23
-
24
-
25
-
26
-
27
-
28
-
 29
29 -
 30
30 -
 31
31 -
 32
32 -
 33
33 -
 34
34 -
 35
35 -
 36
36 -
 37
37 -
 38
38 -
 39
39 -
 40
40 -
 41
41 -
 42
42 -
 43
43 -
 44
44 -
 45
45 -
 46
46 -
 47
47 -
 48
48 -
 49
49 -
50
-
51
-
52
-
53
-
54
-
55
-
56
-
57
-
58
-
59
-
60
-
61
-
62
-
63
-
64
-
65
-
66
-
67
-
68
-
69
-
70
-
71
-
72
-
73
-
74
-
75
-
76
-
77
-
78
-
79
-
80
-
81
-
82
-
83
-
84
-
85
-
86
-
87
-
88
-
89
-
90
-
91
-
92
-
93
-
94
-
95
-
96
-
97
-
98
-
99
-
100
-
101
-
102
-
103
-
104
 |
 |

ENERGIZER HOLDINGS, INC.
(Dollars in millions, except per share and percentage data)
Unless we indicate otherwise, we base the information concerning our industry contained or incorporated by reference herein
on our general knowledge of and expectations concerning the industry. Our market position, market share and industry market
size is based on our estimates using our internal data and estimates, based on data from various industry sources, our internal
research and adjustments and assumptions that we believe to be reasonable. We have not independently verified data from
industry sources and cannot guarantee their accuracy or completeness. In addition, we believe that data regarding the industry,
market size and our market position and market share within such industry provide general guidance but are inherently
imprecise. Further, our estimates and assumptions involve risks and uncertainties and are subject to change based on various
factors, including those discussed in the “Risk factors” section of this Annual Report on Form 10-K. These and other factors
could cause results to differ materially from those expressed in the estimates and assumptions.
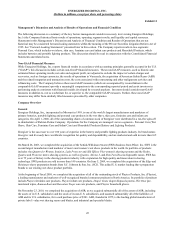
Fiscal 2011 Developments
American Safety Razor Acquisition
On November 23, 2010, we completed the acquisition of ASR, as we acquired substantially all of the assets of ASR, including
the assets of its U.S. subsidiaries and the stock of its non-U.S. subsidiaries, and assumed substantially all of the liabilities of
ASR and its U.S. subsidiaries, for a cash purchase price of $301. The Company financed this transaction with available cash of
approximately $129 and borrowings from our existing receivable securitization program. ASR is part of our wet shave product
group under our Personal Care Segment. See Note 3 to the Consolidated Financial Statements for further details.
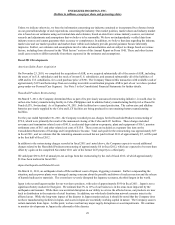
Household Products Restructuring
On March 7, 2011, the Company determined that, as part of its previously announced restructuring initiative, it would close its
carbon zinc battery manufacturing facility in Cebu, Philippines and its alkaline battery manufacturing facility in La Chaux De
Fonds (LCF), Switzerland. As of September 30, 2011, both facilities have ceased production. The carbon zinc and alkaline
batteries previously supplied by the Cebu and LCF facilities are being produced in our remaining battery manufacturing
facilities.
For the year ended September 30, 2011, the Company recorded pre-tax charges for the Household Products restructuring of
$79.0, which were primarily the result of the announced closing of the Cebu and LCF facilities. These charges included
severance and termination related costs of $41.8, accelerated depreciation on property, plant and equipment of $16.1, pension
settlement costs of $6.1 and other related exit costs of $15.0. These costs are included as a separate line item on the
Consolidated Statements of Earnings and Comprehensive Income. Total cash paid for the restructuring was approximately $57
in fiscal 2011, and we estimate that the remaining amounts accrued but not paid in fiscal 2011 of approximately $7, will be paid
in the first half of fiscal 2012.
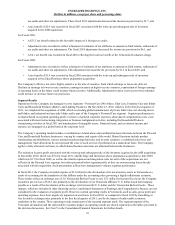
In addition to the restructuring charges recorded in fiscal 2011 and noted above, the Company expects to record additional
charges related to the Household Products restructuring of approximately $6 in fiscal 2012, which are expected to be more than
offset by a gain on the completed November 2011 sale of the former LCF property to a third party.
We anticipate $30 to $35 of annual pre-tax savings from the restructuring by the end of fiscal 2012, of which approximately
$11 has been realized in fiscal 2011.
Japan Earthquake and Related Events
On March 11, 2011, an earthquake struck off the northeast coast of Japan, triggering a tsunami. Further compounding the
situation, nuclear power plants were damaged causing concerns about the possible meltdown of nuclear reactors and the release
of harmful radioactive materials. The events have severely disrupted the Japanese economy, the third largest in the world.
Japan is the second largest market for our wet shave products, with sales of approximately $190 in fiscal 2011. Japan is not a
significant battery market for Energizer. We estimate that 5% to 10% of our business is in the areas most impacted by the
earthquake and tsunami. While there was an initial disruption in our ability to service the affected areas, our products are now
back in distribution in the majority of retail locations. In addition, our wholesale distribution network remains intact in the
affected areas. While the long-term impact of the disaster in Japan remains unclear, it should be noted that the Company does
not have manufacturing facilities in Japan, and assets in Japan are essentially working capital in nature. The Company sources
certain materials from Japan. At this point, we have not had any major supply disruptions or asset impairments. We continue
to monitor developments in Japan in the aftermath of the disaster.
29