Energizer 2011 Annual Report Download - page 80
Download and view the complete annual report
Please find page 80 of the 2011 Energizer annual report below. You can navigate through the pages in the report by either clicking on the pages listed below, or by using the keyword search tool below to find specific information within the annual report.-
 1
1 -
2
-
3
-
4
-
5
-
6
-
7
-
8
-
9
-
10
-
11
-
12
-
13
-
14
-
15
-
16
-
17
-
18
-
19
-
20
-
21
-
22
-
23
-
24
-
25
-
26
-
27
-
28
-
29
-
30
-
31
-
32
-
33
-
34
-
35
-
36
-
37
-
38
-
39
-
40
-
41
-
42
-
43
-
44
-
45
-
46
-
47
-
48
-
49
-
50
-
51
-
52
-
53
-
54
-
55
-
56
-
57
-
58
-
59
-
60
-
61
-
62
-
63
-
64
-
65
-
66
-
67
-
68
-
69
-
 70
70 -
 71
71 -
 72
72 -
 73
73 -
 74
74 -
 75
75 -
 76
76 -
 77
77 -
 78
78 -
 79
79 -
 80
80 -
 81
81 -
 82
82 -
 83
83 -
 84
84 -
 85
85 -
 86
86 -
 87
87 -
 88
88 -
 89
89 -
 90
90 -
91
-
92
-
93
-
94
-
95
-
96
-
97
-
98
-
99
-
100
-
101
-
102
-
103
-
104
 |
 |

ENERGIZER HOLDINGS, INC.
NOTES TO CONSOLIDATED FINANCIAL STATEMENTS
(Dollars in millions, except per share and percentage data)
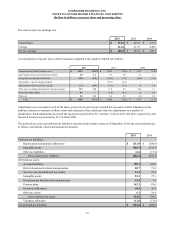
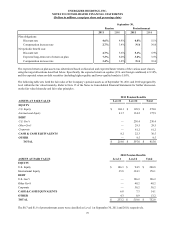
Plan obligations:
Discount rate
Compensation increase rate
Net periodic benefit cost:
Discount rate
Expected long-term rate of return on plan
Compensation increase rate
September 30,
Pension
2011
4.6%
2.7%
4.7%
7.3%
3.4%
2010
4.8%
3.4%
5.6%
8.0%
3.8%
Postretirement
2011
4.8%
N/A
5.1%
3.2%
N/A
2010
5.1%
N/A
5.9%
3.5%
N/A
The expected return on plan assets was determined based on historical and expected future returns of the various asset classes,
using the target allocations described below. Specifically, the expected return on equities (U.S. and foreign combined) is 9.38%,
and the expected return on debt securities (including higher-quality and lower-quality bonds) is 5.05%.
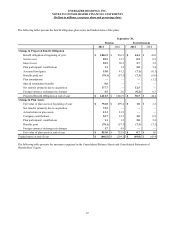
The following table sets forth the fair value of the Company’s pension assets as of September 30, 2011 and 2010 segregated by
level within the fair value hierarchy. Refer to Note 15 of the Notes to Consolidated Financial Statements for further discussion
on the fair value hierarchy and fair value principles.
ASSETS AT FAIR VALUE
EQUITY
U.S. Equity
International Equity
DEBT
U.S. Gov't
Other Gov't
Corporate
CASH & CASH EQUIVALENTS
OTHER
TOTAL
2011 Pension Benefits
Level 1
$ 168.1
41.7
—
—
—
8.2
—
$ 218.0
Level 2
$ 109.9
134.2
230.4
29.5
61.2
22.3
9.5
$ 597.0
Total
$ 278.0
175.9
230.4
29.5
61.2
30.5
9.5
$ 815.0
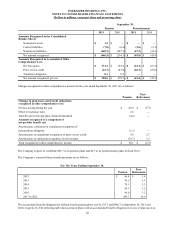
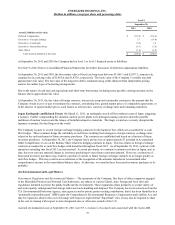
ASSETS AT FAIR VALUE
EQUITY
U.S. Equity
International Equity
DEBT
U.S. Gov't
Other Gov't
Corporate
CASH & CASH EQUIVALENTS
OTHER
TOTAL
2010 Pension Benefits
Level 1
$ 186.3
35.8
—
—
—
6.8
4.3
$ 233.2
Level 2
$ 94.5
134.3
196.2
48.2
30.2
7.3
8.9
$ 519.6
Total
$ 280.8
170.1
196.2
48.2
30.2
14.1
13.2
$ 752.8
The $0.7 and $1.0 of postretirement assets were classified as Level 1 at September 30, 2011 and 2010, respectively.
70