Energizer 2011 Annual Report Download - page 41
Download and view the complete annual report
Please find page 41 of the 2011 Energizer annual report below. You can navigate through the pages in the report by either clicking on the pages listed below, or by using the keyword search tool below to find specific information within the annual report.-
 1
1 -
2
-
3
-
4
-
5
-
6
-
7
-
8
-
9
-
10
-
11
-
12
-
13
-
14
-
15
-
16
-
17
-
18
-
19
-
20
-
21
-
22
-
23
-
24
-
25
-
26
-
27
-
28
-
29
-
30
-
 31
31 -
 32
32 -
 33
33 -
 34
34 -
 35
35 -
 36
36 -
 37
37 -
 38
38 -
 39
39 -
 40
40 -
 41
41 -
 42
42 -
 43
43 -
 44
44 -
 45
45 -
 46
46 -
 47
47 -
 48
48 -
 49
49 -
 50
50 -
 51
51 -
52
-
53
-
54
-
55
-
56
-
57
-
58
-
59
-
60
-
61
-
62
-
63
-
64
-
65
-
66
-
67
-
68
-
69
-
70
-
71
-
72
-
73
-
74
-
75
-
76
-
77
-
78
-
79
-
80
-
81
-
82
-
83
-
84
-
85
-
86
-
87
-
88
-
89
-
90
-
91
-
92
-
93
-
94
-
95
-
96
-
97
-
98
-
99
-
100
-
101
-
102
-
103
-
104
 |
 |

ENERGIZER HOLDINGS, INC.
(Dollars in millions, except per share and percentage data)
Operating Results
Net Sales
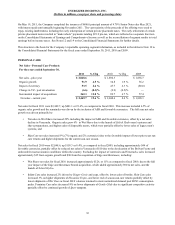
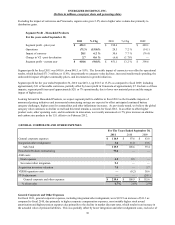
Net Sales - Total Company
For the Years Ended September 30,
Net sales - prior year
Organic change
Impact of currency
Change in VZ - post devaluation
Incremental impact of acquisitions
Net sales - current year
2011
$ 4,248.3
42.0
108.4
(15.3)
262.3
$ 4,645.7
% Chg
1.0 %
2.6 %
(0.4)%
6.2 %
9.4 %
2010
$ 3,999.8
80.7
101.4
(23.3)
89.7
$ 4,248.3
% Chg
2.1 %
2.5 %
(0.6)%
2.2 %
6.2 %
2009
$ 4,331.0
(164.3)
(224.3)
—
57.4
$ 3,999.8
Net sales for fiscal 2011 were $4,645.7, an increase of $397.4, or 9.4%, as compared to fiscal 2010, due primarily to the
inclusion of ASR and the favorable impacts of currencies. On an organic basis, net sales for the fiscal year increased 1% as
higher sales in Personal Care due, in part, to the Schick Hydro launch, higher sales of disposable razors and stronger Skin Care
revenue were offset by declines in Household Products and legacy men's razor systems.
Net sales for fiscal 2010 were $4,248.3, an increase of $248.5, or 6.2%, as compared to fiscal 2009, including the favorable
impact of currencies of approximately $100, and a year-over-year increase of approximately $90 from the full year ownership
of the Edge and Skintimate shave preparation brands. The total year growth was also positively impacted by the Schick Hydro
launch in the third quarter of fiscal 2010. The devaluation and difficult economic conditions in Venezuela resulted in a
reduction in net sales of approximately $23 in fiscal 2010. Net sales for both Personal Care and Household Products grew
approximately 2% on an organic basis in fiscal 2010.
For further discussion regarding net sales in Personal Care and Household Products, please see the section titled “Segment
Results” provided below.
Gross Profit
Gross profit dollars were $2,145.7 in fiscal 2011, an increase of $126.4, or 6.3% as compared to $2,019.3 in fiscal 2010 and
$1,858.6 in fiscal 2009.
Gross Margin as a percent of net sales for fiscal 2011 was 46.2%, down 130 basis points as compared to fiscal 2010. This
decrease was due primarily to the inclusion of value priced ASR products, which reduced gross margin by approximately 130
basis points during the period. In addition, higher commodity costs primarily in batteries, and higher coupon and trade
promotion related to the Schick Hydro launch were offset by favorable currencies and product mix.
Gross margin as a percent of net sales was 47.5% in fiscal 2010 and 46.5% in fiscal 2009. The margin percentage increase in
fiscal 2010 was due primarily to favorable currencies, excluding Venezuela, which added approximately 90 basis points.
Selling, General and Administrative
Selling, general and administrative expenses (SG&A) were $856.1, or 18.4% of net sales as compared to $765.7, or 18.0% of
net sales for fiscal 2010. The dollar increase of $90.4 was due to the inclusion of approximately $49 of expenses related to
ASR, which were not incurred in the prior year, the unfavorable impact of currencies of approximately $19, investments in
growth initiatives of approximately $12 and approximately $10 in higher pension expenses due primarily to the actuarial
impact of lower market discount rates on the value of pension liabilities. ASR expenses in fiscal 2011 included approximately
$13 million of non-recurring transaction/integration expenses. SG&A increased $23.1 in fiscal 2010 as compared to fiscal
2009 due primarily to the impact of annual merit increases and support of growth initiatives.
Advertising and Promotion
For fiscal 2011, advertising and promotion (A&P) was $524.0, an increase of $62.7 as compared to fiscal 2010. A&P as a
percent of net sales for fiscal 2011 was 11.3% as compared 10.9% of net sales in fiscal 2010. Excluding the net sales and A&P
related to ASR, which has a relatively low level of consumer spending in comparison to our other products, A&P as a percent
31