Energizer 2011 Annual Report Download - page 40
Download and view the complete annual report
Please find page 40 of the 2011 Energizer annual report below. You can navigate through the pages in the report by either clicking on the pages listed below, or by using the keyword search tool below to find specific information within the annual report.-
 1
1 -
2
-
3
-
4
-
5
-
6
-
7
-
8
-
9
-
10
-
11
-
12
-
13
-
14
-
15
-
16
-
17
-
18
-
19
-
20
-
21
-
22
-
23
-
24
-
25
-
26
-
27
-
28
-
29
-
 30
30 -
 31
31 -
 32
32 -
 33
33 -
 34
34 -
 35
35 -
 36
36 -
 37
37 -
 38
38 -
 39
39 -
 40
40 -
 41
41 -
 42
42 -
 43
43 -
 44
44 -
 45
45 -
 46
46 -
 47
47 -
 48
48 -
 49
49 -
 50
50 -
51
-
52
-
53
-
54
-
55
-
56
-
57
-
58
-
59
-
60
-
61
-
62
-
63
-
64
-
65
-
66
-
67
-
68
-
69
-
70
-
71
-
72
-
73
-
74
-
75
-
76
-
77
-
78
-
79
-
80
-
81
-
82
-
83
-
84
-
85
-
86
-
87
-
88
-
89
-
90
-
91
-
92
-
93
-
94
-
95
-
96
-
97
-
98
-
99
-
100
-
101
-
102
-
103
-
104
 |
 |

ENERGIZER HOLDINGS, INC.
(Dollars in millions, except per share and percentage data)
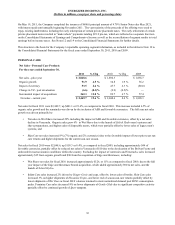
Senior Notes Offering
On May 19, 2011, the Company completed the issuance of $600.0 principal amount of 4.70% Senior Notes due May 2021,
with interest paid semi-annually beginning November 2011. The majority of the proceeds were used to repay existing
indebtedness including refinancing $475 of private placement notes with maturities ranging from 2011 to 2013. The early
retirement of certain of the private placement notes resulted in make-whole payments totaling $19.9, pre-tax, which is reflected
as a separate line item on the attached Statements of Earnings and Comprehensive Income. The issuance of the notes extended
the maturities of our long-term debt, and reduced the level of scheduled principal repayments in 2012 and 2013.
Financial Results
For the year ended September 30, 2011, net earnings were $261.2, or $3.72 per diluted share, compared to net earnings of
$403.0, or $5.72 per diluted share, in fiscal 2010 and $297.8, or $4.72 per diluted share, in fiscal 2009. Total average diluted
shares outstanding were 70.3 million, 70.5 million and 63.1 million for fiscal 2011, 2010 and 2009, respectively. In fiscal 2011,
the Company repurchased 3.7 million shares with the majority repurchased in the fourth fiscal quarter. We estimate that the
share repurchase positively impacted diluted earnings per share by approximately $0.06 for fiscal 2011.
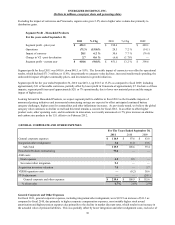
Diluted earnings per share (EPS) for each fiscal year were impacted by certain items related to restructuring and realignment
activities, costs associated with the acquisition and integration of acquired businesses, refinancing activities, the devaluation
and implementation of highly inflationary accounting in Venezuela, and certain tax adjustments to update prior year provisions/
benefits and net deferred tax balances and recognize the tax benefit of certain foreign dividends. The impacts of these items on
reported net earnings per diluted share are provided below as a reconciliation of net earnings per diluted share to adjusted net
earnings per diluted share, which is a non-GAAP measure.
Diluted EPS - GAAP
Impacts, net of tax: Expense (Income)
Household Products restructuring
Early debt retirement / duplicate interest
Other realignment/integration
Acquisition inventory valuation
Venezuela (VZ) devaluation/other
PTO Adjustment
VERO/Separation Costs
Valuation allowance, other tax adjustments
Diluted EPS - adjusted (Non-GAAP)
For The Years Ended
September 30,
2011
$ 3.72
0.89
0.21
0.15
0.06
0.03
—
—
0.14
$ 5.20
2010
$ 5.72
—
—
0.10
—
0.20
—
—
(0.42)
$ 5.60
2009
$ 4.72
—
—
0.13
0.04
—
(0.24)
0.39
0.02
$ 5.06
30