Energizer 2011 Annual Report Download - page 57
Download and view the complete annual report
Please find page 57 of the 2011 Energizer annual report below. You can navigate through the pages in the report by either clicking on the pages listed below, or by using the keyword search tool below to find specific information within the annual report.-
 1
1 -
2
-
3
-
4
-
5
-
6
-
7
-
8
-
9
-
10
-
11
-
12
-
13
-
14
-
15
-
16
-
17
-
18
-
19
-
20
-
21
-
22
-
23
-
24
-
25
-
26
-
27
-
28
-
29
-
30
-
31
-
32
-
33
-
34
-
35
-
36
-
37
-
38
-
39
-
40
-
41
-
42
-
43
-
44
-
45
-
46
-
 47
47 -
 48
48 -
 49
49 -
 50
50 -
 51
51 -
 52
52 -
 53
53 -
 54
54 -
 55
55 -
 56
56 -
 57
57 -
 58
58 -
 59
59 -
 60
60 -
 61
61 -
 62
62 -
 63
63 -
 64
64 -
 65
65 -
 66
66 -
 67
67 -
68
-
69
-
70
-
71
-
72
-
73
-
74
-
75
-
76
-
77
-
78
-
79
-
80
-
81
-
82
-
83
-
84
-
85
-
86
-
87
-
88
-
89
-
90
-
91
-
92
-
93
-
94
-
95
-
96
-
97
-
98
-
99
-
100
-
101
-
102
-
103
-
104
 |
 |

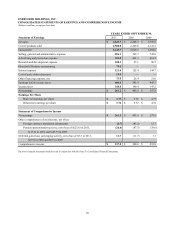
Summary Selected Historical Financial Information
(In millions, except per share data)
Statements of Earnings Data (a)
Net sales
Depreciation and amortization
Earnings before income taxes (b)
Income taxes
Net earnings (c)
Earnings per share:
Basic
Diluted
Average shares outstanding:
Basic
Diluted
Balance Sheet Data
Working capital
Property, plant and equipment, net
Total assets
Long-term debt
FOR THE YEARS ENDED SEPTEMBER 30,
2011
$ 4,645.7
181.3
406.0
144.8
$ 261.2
$ 3.75
$ 3.72
69.6
70.3
AT SEPTEMBER 30,
2011
$ 1,233.3
885.4
6,663.4
2,206.5
2010
$ 4,248.3
139.2
543.4
140.4
$ 403.0
$ 5.76
$ 5.72
70.0
70.5
2010
$ 1,176.0
840.6
6,387.9
2,022.5
2009
$ 3,999.8
130.4
445.3
147.5
$ 297.8
$ 4.77
$ 4.72
62.4
63.1
2009
$ 966.3
863.4
6,149.0
2,288.5
2008
$ 4,331.0
141.3
473.2
143.9
$ 329.3
$ 5.71
$ 5.59
57.6
58.9
2008 (a)
$ 665.1
835.5
5,816.7
2,589.5
2007
$ 3,365.1
115.0
434.2
112.8
$ 321.4
$ 5.67
$ 5.51
56.7
58.3
2007
$ 888.5
649.9
3,525.7
1,372.0
(a) Year over year comparatives may be impacted in varying degrees by acquisitions.
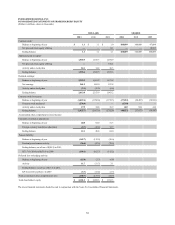
(b) Earnings before income taxes were (reduced)/increased by the following items:
Household Products restructuring
Early debt retirement/duplicate interest
ASR transaction costs/integration
Acquisition inventory valuation
Other realignment/integration costs
Venezuela devaluation/other impacts
VERO/reduction in force costs
PTO adjustment
Total
FOR THE YEARS ENDED SEPTEMBER 30,
2011
$ (79.0)
(22.9)
(13.5)
(7.0)
(3.0)
(1.8)
—
—
$ (127.2)
2010
$—
—
(0.5)
—
(11.0)
(18.3)
0.2
—
$ (29.6)
2009
$—
—
—
(3.7)
(13.6)
—
(38.6)
24.1
$ (31.8)
2008
$—
—
—
(27.5)
(21.1)
—
—
—
$ (48.6)
2007
$—
—
—
—
(18.2)
—
—
—
$ (18.2)
(c) Net earnings were (reduced)/increased by the following items:
Household Products restructuring
Early debt retirement/duplicate interest
ASR transaction costs/integration
Acquisition inventory valuation
Other realignment/integration costs
Venezuela devaluation/other impacts
VERO/reduction in force costs
PTO adjustment
Adjustments to valuation allowances and prior years tax accruals
Tax benefits - special foreign dividend
Deferred tax benefit due to statutory rate change
Total
FOR THE YEARS ENDED SEPTEMBER 30,
2011
$ (63.3)
(14.4)
(8.5)
(4.4)
(2.0)
(1.8)
—
—
(9.7)
—
—
$ (104.1)
2010
$—
—
—
—
(7.4)
(14.2)
0.1
—
6.1
23.5
—
$ 8.1
2009
$—
—
—
(2.3)
(8.9)
—
(24.3)
15.2
(1.5)
—
—
$ (21.8)
2008
$—
—
—
(16.5)
(13.4)
—
—
—
(1.1)
—
—
$ (31.0)
2007
$—
—
—
—
(12.2)
—
—
—
12.2
—
9.7
$ 9.7
47