Energizer 2011 Annual Report Download - page 77
Download and view the complete annual report
Please find page 77 of the 2011 Energizer annual report below. You can navigate through the pages in the report by either clicking on the pages listed below, or by using the keyword search tool below to find specific information within the annual report.-
 1
1 -
2
-
3
-
4
-
5
-
6
-
7
-
8
-
9
-
10
-
11
-
12
-
13
-
14
-
15
-
16
-
17
-
18
-
19
-
20
-
21
-
22
-
23
-
24
-
25
-
26
-
27
-
28
-
29
-
30
-
31
-
32
-
33
-
34
-
35
-
36
-
37
-
38
-
39
-
40
-
41
-
42
-
43
-
44
-
45
-
46
-
47
-
48
-
49
-
50
-
51
-
52
-
53
-
54
-
55
-
56
-
57
-
58
-
59
-
60
-
61
-
62
-
63
-
64
-
65
-
66
-
 67
67 -
 68
68 -
 69
69 -
 70
70 -
 71
71 -
 72
72 -
 73
73 -
 74
74 -
 75
75 -
 76
76 -
 77
77 -
 78
78 -
 79
79 -
 80
80 -
 81
81 -
 82
82 -
 83
83 -
 84
84 -
 85
85 -
 86
86 -
 87
87 -
88
-
89
-
90
-
91
-
92
-
93
-
94
-
95
-
96
-
97
-
98
-
99
-
100
-
101
-
102
-
103
-
104
 |
 |

ENERGIZER HOLDINGS, INC.
NOTES TO CONSOLIDATED FINANCIAL STATEMENTS
(Dollars in millions, except per share and percentage data)
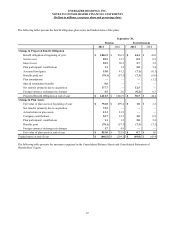
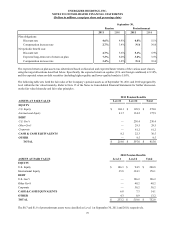
The following tables present the benefit obligation, plan assets and funded status of the plans:
Change in Projected Benefit Obligation
Benefit obligation at beginning of year
Service cost
Interest cost
Plan participants' contributions
Actuarial loss/(gain)
Benefits paid, net
Plan amendments
Special termination benefits
Net transfer primarily due to acquisition
Foreign currency exchange rate changes
Projected Benefit Obligation at end of year
Change in Plan Assets
Fair value of plan assets at beginning of year
Net transfer primarily due to acquisition
Actual return on plan assets
Company contributions
Plan participants' contributions
Benefits paid
Foreign currency exchange rate changes
Fair value of plan assets at end of year
Funded status at end of year
September 30,
Pension
2011
$ 1,046.9
28.9
55.9
1.1
15.0
(78.1)
—
9.6
177.7
4.5
$ 1,261.5
$ 752.8
72.5
12.3
52.7
1.1
(78.1)
1.7
$ 815.0
$(446.5)
2010
$ 936.3
32.7
50.2
1.2
81.2
(57.3)
—
—
—
2.6
$ 1,046.9
$ 699.4
—
81.5
23.2
1.2
(57.3)
4.8
$ 752.8
$(294.1)
Postretirement
2011
$ 44.4
0.5
2.7
5.0
(7.1)
(7.3)
—
—
12.5
(0.2)
$ 50.5
$ 1.0
—
—
2.0
5.0
(7.3)
—
$ 0.7
$(49.8)
2010
$ 43.6
0.5
2.5
5.4
(0.1)
(6.6)
(1.2)
—
—
0.3
$ 44.4
$ 2.2
—
—
0.9
5.4
(7.5)
—
$ 1.0
$(43.4)
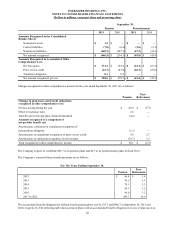
The following table presents the amounts recognized in the Consolidated Balance Sheets and Consolidated Statements of
Shareholders’ Equity.
67