Energizer 2011 Annual Report Download - page 51
Download and view the complete annual report
Please find page 51 of the 2011 Energizer annual report below. You can navigate through the pages in the report by either clicking on the pages listed below, or by using the keyword search tool below to find specific information within the annual report.-
 1
1 -
2
-
3
-
4
-
5
-
6
-
7
-
8
-
9
-
10
-
11
-
12
-
13
-
14
-
15
-
16
-
17
-
18
-
19
-
20
-
21
-
22
-
23
-
24
-
25
-
26
-
27
-
28
-
29
-
30
-
31
-
32
-
33
-
34
-
35
-
36
-
37
-
38
-
39
-
40
-
 41
41 -
 42
42 -
 43
43 -
 44
44 -
 45
45 -
 46
46 -
 47
47 -
 48
48 -
 49
49 -
 50
50 -
 51
51 -
 52
52 -
 53
53 -
 54
54 -
 55
55 -
 56
56 -
 57
57 -
 58
58 -
 59
59 -
 60
60 -
 61
61 -
62
-
63
-
64
-
65
-
66
-
67
-
68
-
69
-
70
-
71
-
72
-
73
-
74
-
75
-
76
-
77
-
78
-
79
-
80
-
81
-
82
-
83
-
84
-
85
-
86
-
87
-
88
-
89
-
90
-
91
-
92
-
93
-
94
-
95
-
96
-
97
-
98
-
99
-
100
-
101
-
102
-
103
-
104
 |
 |

ENERGIZER HOLDINGS, INC.
(Dollars in millions, except per share and percentage data)
maturities extending into fiscal 2013 are not material. As noted previously, we continue to monitor activities in Japan, and, to
date, have not seen any material change in inventory purchasing to meet future consumer demand. However, a reduction of
forecasted inventory purchases may result in a portion of current or future foreign exchange contracts to no longer qualify as
cash flow hedges. This may result in an acceleration of the recognition of the amounts included in Accumulated Other
Comprehensive Income in the consolidated balance sheet. At this time, we consider these forecasted inventory purchases to be
probable.
Commodity Price Exposure
The Company uses raw materials that are subject to price volatility. At times, hedging instruments are used by the Company to
reduce exposure to variability in cash flows associated with future purchases of zinc or other commodities. The fair market
value of the Company’s outstanding hedging instruments included in Accumulated other comprehensive loss on the
Consolidated Balance Sheets was an unrealized pre-tax loss of $6.2 and pre-tax gain of $1.0 at September 30, 2011 and 2010,
respectively. Over the next twelve months, approximately $5.6 of the loss included in Accumulated other comprehensive loss
will be included in earnings. Contract maturities for these hedges extend into fiscal year 2012. There were 18 open contracts at
September 30, 2011.
Interest Rate Exposure
At September 30, 2011 and 2010, the fair market value of the Company's fixed rate debt is estimated at $1,969.3 and $2,077.5,
respectively, using yields obtained from independent pricing sources for similar types of borrowing arrangements. The fair
value of debt is greater than the carrying value of the Company's debt by $104.3 and $242.5 at September 30, 2011 and 2010,
respectively. A 10% decrease in interest rates on fixed-rate debt would have increased the fair market value by $48.1 and $18.9
at September 30, 2011 and 2010, respectively. See Note 12 to the Consolidated Financial Statements for additional information
regarding the Company’s debt.
The Company has interest rate risk with respect to interest expense on variable rate debt. At September 30, 2011, the Company
had $503.5 of variable rate debt outstanding, of which $300 is hedged via interest rate swap agreements as disclosed below. As
a result, after giving effect to the hedged amount, a hypothetical one percentage point increase in variable interest rates would
have an annual unfavorable impact of approximately $2 on the Company’s earnings before taxes and cash flows, based upon
the current variable debt level at September 30, 2011.
During fiscal 2009, the Company entered into interest rate swap agreements with two major financial institutions that fixed the
variable benchmark component (LIBOR) of the Company’s interest rate on $300 of the Company’s variable rate debt for the
next year at 1.9%. These hedging instruments are considered cash flow hedges for accounting purposes. The Company had an
unrealized pre-tax loss on these interest rate swap agreements included in Accumulated other comprehensive loss on the
Consolidated Balance Sheets of $4.7 and $7.8 at September 30, 2011 and 2010, respectively.
Stock Price Exposure
At September 30, 2011, the Company held a share option with a major financial institution to mitigate the impact of changes in
certain of the Company’s unfunded deferred compensation liabilities, which are tied to the Company’s common stock price.
The fair market value of the share option was $3.4 and $2.9 as included in other current liabilities at September 30, 2011 and
2010, respectively. The change in fair value of the total share option for fiscal 2011and 2010 resulted in expense of $0.6 and
income of $0.6 respectively, and was recorded in SG&A. Period activity related to the share option is classified in the same
category in the Consolidated Statements of Cash Flows as the period activity associated with the Company’s deferred
compensation liability, which was cash flow from operations.
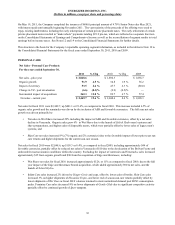
Seasonal Factors
The Company's Household Products segment results are typically impacted in the first quarter of the fiscal year by the
additional sales volume associated with the December holiday season, particularly in North America. First quarter sales
accounted for 30%, 32% and 31% of total Household Products net sales in fiscal 2011, 2010 and 2009, respectively. In
addition, natural disasters, such as hurricanes, can create conditions that drive exceptional needs for portable power and spike
battery and lighting products sales.
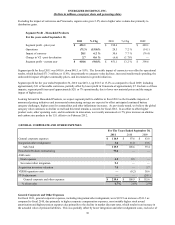
Customer orders for the Company’s sun care products are highly seasonal, which has historically resulted in higher sun care
sales in the second and third quarters of our fiscal year and lower sales in the first and fourth quarters of our fiscal year. As a
result, sales, operating income, working capital and cash flows for the Personal Care segment can vary significantly between
quarters of the same and different years due to the seasonality and timing of orders for sun care products.
Other factors may also have an impact on the timing and amounts of sales, operating income, working capital and cash flows.
41