Energizer 2011 Annual Report Download - page 48
Download and view the complete annual report
Please find page 48 of the 2011 Energizer annual report below. You can navigate through the pages in the report by either clicking on the pages listed below, or by using the keyword search tool below to find specific information within the annual report.-
 1
1 -
2
-
3
-
4
-
5
-
6
-
7
-
8
-
9
-
10
-
11
-
12
-
13
-
14
-
15
-
16
-
17
-
18
-
19
-
20
-
21
-
22
-
23
-
24
-
25
-
26
-
27
-
28
-
29
-
30
-
31
-
32
-
33
-
34
-
35
-
36
-
37
-
 38
38 -
 39
39 -
 40
40 -
 41
41 -
 42
42 -
 43
43 -
 44
44 -
 45
45 -
 46
46 -
 47
47 -
 48
48 -
 49
49 -
 50
50 -
 51
51 -
 52
52 -
 53
53 -
 54
54 -
 55
55 -
 56
56 -
 57
57 -
 58
58 -
59
-
60
-
61
-
62
-
63
-
64
-
65
-
66
-
67
-
68
-
69
-
70
-
71
-
72
-
73
-
74
-
75
-
76
-
77
-
78
-
79
-
80
-
81
-
82
-
83
-
84
-
85
-
86
-
87
-
88
-
89
-
90
-
91
-
92
-
93
-
94
-
95
-
96
-
97
-
98
-
99
-
100
-
101
-
102
-
103
-
104
 |
 |

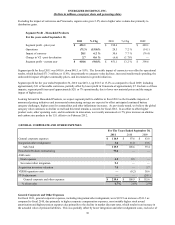
ENERGIZER HOLDINGS, INC.
(Dollars in millions, except per share and percentage data)
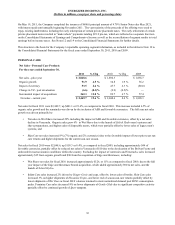
From a working capital perspective, changes in assets and liabilities used in operations (working capital) provided positive cash
flow of $26.8 in fiscal 2010, an improvement of $16.0 as compared to the cash flow generated by changes in working capital in
fiscal 2009. The most significant impact was in accounts payable and other current liabilities, which increased collectively by
$54.1 in fiscal 2010 due primarily to the level of promotional activities during the fourth quarter of fiscal 2010 and the timing
of payments. The favorable cash flow impact due to a higher level of accounts payable and other current liabilities at the end of
fiscal 2010 was partially offset by higher accounts receivable of $26.4 due primarily to inclusion of the fully integrated shave
preparation brands at year-end fiscal 2010.
Investing Activities
Net cash used by investing activities was $363.5, $113.3 and $412.2 in fiscal 2011, 2010 and 2009, respectively. The most
significant impact in fiscal 2011 was the acquisition of ASR for net cash of $267, which reflects a cash purchase price of $301,
net of $34 of acquired cash. The Company financed this transaction with available cash of approximately $129 and borrowings
from our existing receivables securitization program. Capital expenditures were $98.0, $108.7 and $139.7 in fiscal 2011, 2010
and 2009, respectively. These capital expenditures were funded by cash flow from operations. Capital expenditures decreased
somewhat in fiscal 2011 due to the timing of project-related spending including capital associated with new product initiatives.
See Note 19 to the Consolidated Financial Statements for capital expenditures by segment.
In fiscal 2009, the Company paid $275.0 for the acquisition of the Edge and Skintimate shave preparation brands.
Capital expenditures of approximately $100 to $110 are anticipated in fiscal 2012 with disbursements for new product and cost
reduction-related capital driving the largest components of projected capital spending. Such capital expenditures are expected
to be financed with funds generated from operations.
Financing Activities
The Company’s total borrowings were $2,368.5 at September 30, 2011, including $503.5 tied to variable interest rates of which
$300 is hedged via the interest rate swap agreements described below. The Company maintained total committed debt facilities
of $2,818.5, exclusive of available borrowings under the receivables securitization program, of which $438.2 remained
available as of September 30, 2011, as reduced by $11.8 of outstanding letters of credit.
Under the terms of the Company’s credit agreements, the ratio of the Company’s indebtedness to its EBITDA, as defined in the
agreements and detailed below, cannot be greater than 4.00 to 1, and may not remain above 3.50 to 1 for more than four
consecutive quarters. If and so long as the ratio is above 3.50 to 1 for any period, the Company is required to pay additional
interest expense for the period in which the ratio exceeds 3.50 to 1. The interest rate margin and certain fees vary depending on
the indebtedness to EBITDA ratio. Under the Company’s private placement note agreements, the ratio of indebtedness to
EBITDA may not exceed 4.0 to 1. However, if the ratio is above 3.50 to 1, the Company is required to pay an additional 75
basis points in interest for the period in which the ratio exceeds 3.50 to 1. In addition, under the credit agreements, the ratio of
its current year EBIT, as defined in the agreements, to total interest expense must exceed 3.00 to 1. The Company’s ratio of
indebtedness to its proforma EBITDA was 2.92 to 1, and the ratio of its proforma EBIT to total interest expense was 4.33 to 1,
as of September 30, 2011. These ratios were negatively impacted by a significant portion of the pre-tax charges associated with
the Household Products restructuring activities in fiscal 2011 as such charges reduced EBITDA as defined in the agreements.
If the Company fails to comply with the financial covenants referred to above or with other requirements of the credit
agreements or private placement note agreements, the lenders would have the right to accelerate the maturity of the debt.
Acceleration under one of these facilities would trigger cross defaults on other borrowings.
Under the credit agreements, EBITDA is defined as net earnings, as adjusted to add-back interest expense, income taxes,
depreciation and amortization, all of which are determined in accordance with GAAP. In addition, the credit agreement allows
certain non-cash charges such as stock award amortization and asset write-offs or impairments to be “added-back” in
determining EBITDA for purposes of the indebtedness ratio. Severance and other cash charges incurred as a result of
restructuring and realignment activities as well as expenses incurred in acquisition integration activities are included as
reductions in EBITDA for calculation of the indebtedness ratio. In the event of an acquisition, such as ASR in the first quarter
of fiscal 2011, the EBITDA is calculated on a proforma basis to include the trailing twelve-month EBITDA of the acquired
company or brands. Total debt is calculated in accordance with GAAP, but excludes outstanding borrowings under the
receivable securitization program. EBIT is calculated in a fashion identical to EBITDA except that depreciation and
amortization are not “added-back”. Total interest expense is calculated in accordance with GAAP.
The Company has staggered long-term borrowing maturities to reduce refinancing risk in any single year and to optimize the
use of free cash flow. The Company believes that cash on hand, cash flows from operating activities and periodic borrowings
38