Energizer 2011 Annual Report Download - page 45
Download and view the complete annual report
Please find page 45 of the 2011 Energizer annual report below. You can navigate through the pages in the report by either clicking on the pages listed below, or by using the keyword search tool below to find specific information within the annual report.-
 1
1 -
2
-
3
-
4
-
5
-
6
-
7
-
8
-
9
-
10
-
11
-
12
-
13
-
14
-
15
-
16
-
17
-
18
-
19
-
20
-
21
-
22
-
23
-
24
-
25
-
26
-
27
-
28
-
29
-
30
-
31
-
32
-
33
-
34
-
 35
35 -
 36
36 -
 37
37 -
 38
38 -
 39
39 -
 40
40 -
 41
41 -
 42
42 -
 43
43 -
 44
44 -
 45
45 -
 46
46 -
 47
47 -
 48
48 -
 49
49 -
 50
50 -
 51
51 -
 52
52 -
 53
53 -
 54
54 -
 55
55 -
56
-
57
-
58
-
59
-
60
-
61
-
62
-
63
-
64
-
65
-
66
-
67
-
68
-
69
-
70
-
71
-
72
-
73
-
74
-
75
-
76
-
77
-
78
-
79
-
80
-
81
-
82
-
83
-
84
-
85
-
86
-
87
-
88
-
89
-
90
-
91
-
92
-
93
-
94
-
95
-
96
-
97
-
98
-
99
-
100
-
101
-
102
-
103
-
104
 |
 |

ENERGIZER HOLDINGS, INC.
(Dollars in millions, except per share and percentage data)
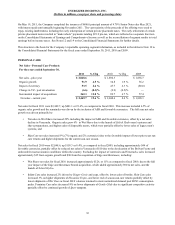
Segment Profit - Personal Care Products
For the years ended September 30,
Segment profit - prior year
Operations
Impact of currency
Change in VZ - post devaluation
Incremental impact of acquisitions
Segment profit - current year
2011
$ 366.6
(11.9)
26.9
(1.2)
28.0
$ 408.4
% Chg
(3.2)%
7.3 %
(0.3)%
7.6 %
11.4 %
2010
$ 341.1
(25.1)
24.9
3.2
22.5
$ 366.6
% Chg
(7.3)%
7.3 %
0.9 %
6.6 %
7.5 %
2009
$ 322.5
33.8
(20.0)
—
4.8
$ 341.1
Segment profit for fiscal 2011 was $408.4, up $41.8, or 11.4%, due to the favorable impacts of the inclusion of ASR and
currencies. This was partially offset by lower operational results of approximately $12, or 3%, due to increased A&P in support
of the Schick Hydro launch partially offset by higher margin from the organic sales growth noted above.
Segment profit for fiscal 2010 was $366.6, up $25.5, or 7.5%, as compared to fiscal 2009, due to the favorable impact of
currencies of approximately $25, exclusive of Venezuela. Excluding the impact of favorable currencies, segment profit was
essentially flat as higher gross margin from the increased sales noted above was offset by higher A&P and overhead spending
due, in part, to the support of the April 2010 Schick Hydro launch in North America and the full year impact of spending behind
Edge and Skintimate. Overall, the Venezuela devaluation and related deterioration in economic conditions in the country did not
have a material impact on year-over-year segment profit.
Looking forward in Personal Care and inclusive of a full year of ASR results, we expect segment profit growth in fiscal 2012
will be primarily driven by mid-single digit organic sales growth. We plan to continue to invest in trial generating activities,
brand equity and growth opportunities across all of our Personal Care categories to grow our sales and continue to enhance the
long term health of the business.
Finally, as noted in our discussion of the ASR acquisition, ASR manufactures and sells industrial and specialty blades. This is a
relatively small product line, with annualized sales of less than $50 and comparatively lower operating margins. We are
evaluating the potential sale of this business, as it is not strategic and does not integrate well into our existing Wet Shave
product line. We estimate that the carrying value of the assets that may be sold was approximately $30 at September 30, 2011.
On November 7, 2011, which is our first fiscal quarter of 2012, the Board of Directors delegated authority to pursue and
approve a potential sale of the industrial blade assets to senior management. The review of this potential action remains on-
going and we can provide no assurance that a sale will be completed.
HOUSEHOLD PRODUCTS
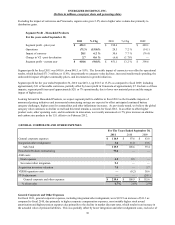
Net Sales - Household Products
For the years ended September 30,
Net sales - prior year
Organic Change
Impact of currency
Change in VZ - post devaluation
Net sales - current year
2011
$ 2,199.7
(49.9)
54.9
(8.7)
$ 2,196.0
% Chg
(2.3)%
2.5 %
(0.4)%
(0.2)%
2010
$ 2,109.5
45.9
57.7
(13.4)
$ 2,199.7
% Chg
2.2 %
2.7 %
(0.6)%
4.3 %
2009
$ 2,474.3
(220.5)
(144.3)
—
$ 2,109.5
For fiscal 2011, net sales were $2,196.0, essentially flat as compared to $2,199.7 for fiscal 2010. Organic sales declined 2.3%
as compared to fiscal 2010 due to continued negative category value trends and increased retailer trade spending, primarily in
the U.S. and Western Europe. We estimate that the dollar value of the battery category in global measured markets declined
in the low single digits in fiscal 2011. This decline in organic sales on a year over year basis was offset by favorable
currencies.
For fiscal 2010, net sales were $2,199.7, up $90.2 or 4.3%, including approximately $58 of favorable currencies. The currency
gains were partially offset by reduced net sales in Venezuela of approximately $13 due to the reasons noted previously.
35