Energizer 2011 Annual Report Download - page 46
Download and view the complete annual report
Please find page 46 of the 2011 Energizer annual report below. You can navigate through the pages in the report by either clicking on the pages listed below, or by using the keyword search tool below to find specific information within the annual report.-
 1
1 -
2
-
3
-
4
-
5
-
6
-
7
-
8
-
9
-
10
-
11
-
12
-
13
-
14
-
15
-
16
-
17
-
18
-
19
-
20
-
21
-
22
-
23
-
24
-
25
-
26
-
27
-
28
-
29
-
30
-
31
-
32
-
33
-
34
-
35
-
 36
36 -
 37
37 -
 38
38 -
 39
39 -
 40
40 -
 41
41 -
 42
42 -
 43
43 -
 44
44 -
 45
45 -
 46
46 -
 47
47 -
 48
48 -
 49
49 -
 50
50 -
 51
51 -
 52
52 -
 53
53 -
 54
54 -
 55
55 -
 56
56 -
57
-
58
-
59
-
60
-
61
-
62
-
63
-
64
-
65
-
66
-
67
-
68
-
69
-
70
-
71
-
72
-
73
-
74
-
75
-
76
-
77
-
78
-
79
-
80
-
81
-
82
-
83
-
84
-
85
-
86
-
87
-
88
-
89
-
90
-
91
-
92
-
93
-
94
-
95
-
96
-
97
-
98
-
99
-
100
-
101
-
102
-
103
-
104
 |
 |

ENERGIZER HOLDINGS, INC.
(Dollars in millions, except per share and percentage data)
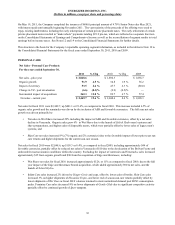
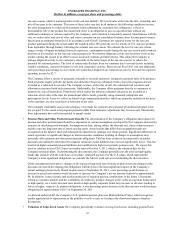
Excluding the impact of currencies and Venezuela, organic sales grew 2.2% due to higher sales volume due primarily to
distribution gains.
Segment Profit - Household Products
For the years ended September 30,
Segment profit - prior year
Operations
Impact of currency
Change in VZ - post devaluation
Segment profit - current year
2011
$ 451.1
(71.3)
28.1
2.7
$ 410.6
% Chg
(15.8)%
6.2 %
0.6 %
(9.0)%
2010
$ 398.6
28.5
30.6
(6.6)
$ 451.1
% Chg
7.2 %
7.7 %
(1.7)%
13.2 %
2009
$ 489.1
(14.1)
(76.4)
—
$ 398.6
Segment profit for fiscal 2011 was $410.6, down $40.5, or 9.0%. The favorable impact of currencies was offset by operational
results, which declined $71.3 million, or 15.8%, due primarily to category value declines, increased retailer trade spending, the
unfavorable impact of higher commodity prices, and investments in growth initiatives.
Segment profit for the year ended September 30, 2010 was $451.1, up $52.5 or 13.2% as compared to fiscal 2009, including
approximately $31 of favorable currencies, partially offset by lower profit in Venezuela of approximately $7. Exclusive of these
impacts, segment profit increased approximately $29, or 7% operationally, due to lower raw material prices and the margin
impact of higher sales.
Looking forward in Household Products, we expect segment profit to stabilize in fiscal 2012 as the favorable impacts of
announced pricing initiatives and incremental restructuring savings are expected to offset anticipated continued battery
category challenges, higher costs for commodities and other inflationary increases. As previously noted, we believe the global
category value continues to decline overall and this trend remains a concern for fiscal 2012. In an effort to offset higher
product costs, other operating costs, and investments in innovation, we recently announced a 6.7% price increase on alkaline
and carbon zinc products in the U.S. effective in February 2012.
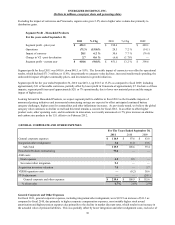
GENERAL CORPORATE AND OTHER EXPENSES
General corporate expenses
Integration/other realignment
Sub-Total
Household Products restructuring
ASR costs:
Deal expenses
Severance/other integration
Acquisition inventory valuation
VERO/separation costs
PTO adjustment
General corporate and other expenses
% of net sales
For The Years Ended September 30,
2011
$ 116.9
3.0
119.9
79.0
4.2
9.3
7.0
—
—
$ 219.4
4.7%
2010
$ 97.6
11.0
108.6
—
0.5
—
—
(0.2)
—
$ 108.9
2.6%
2009
$ 83.8
13.6
97.4
—
—
—
3.7
38.6
(24.1)
$ 115.6
2.9%
General Corporate and Other Expenses
For fiscal 2011, general corporate expenses, including integration/other realignment, were $119.9 an increase of $11.3 as
compared to fiscal 2010, due primarily to higher corporate compensation expenses, most notably higher stock award
amortization and higher pension expenses due primarily to the decline in market discount rates, which results in an increase in
the actuarial value of pension liabilities. This was partially offset by lower integration and other realignment costs, exclusive of
36