Comcast 2013 Annual Report Download - page 98
Download and view the complete annual report
Please find page 98 of the 2013 Comcast annual report below. You can navigate through the pages in the report by either clicking on the pages listed below, or by using the keyword search tool below to find specific information within the annual report.-
 1
1 -
2
-
3
-
4
-
5
-
6
-
7
-
8
-
9
-
10
-
11
-
12
-
13
-
14
-
15
-
16
-
17
-
18
-
19
-
20
-
21
-
22
-
23
-
24
-
25
-
26
-
27
-
28
-
29
-
30
-
31
-
32
-
33
-
34
-
35
-
36
-
37
-
38
-
39
-
40
-
41
-
42
-
43
-
44
-
45
-
46
-
47
-
48
-
49
-
50
-
51
-
52
-
53
-
54
-
55
-
56
-
57
-
58
-
59
-
60
-
61
-
62
-
63
-
64
-
65
-
66
-
67
-
68
-
69
-
70
-
71
-
72
-
73
-
74
-
75
-
76
-
77
-
78
-
79
-
80
-
81
-
82
-
83
-
84
-
85
-
86
-
87
-
 88
88 -
 89
89 -
 90
90 -
 91
91 -
 92
92 -
 93
93 -
 94
94 -
 95
95 -
 96
96 -
 97
97 -
 98
98 -
 99
99 -
 100
100 -
 101
101 -
 102
102 -
 103
103 -
 104
104 -
 105
105 -
 106
106 -
 107
107 -
 108
108 -
109
-
110
-
111
-
112
-
113
-
114
-
115
-
116
-
117
-
118
-
119
-
120
-
121
-
122
-
123
-
124
-
125
-
126
-
127
-
128
-
129
-
130
-
131
-
132
-
133
-
134
-
135
-
136
-
137
-
138
-
139
-
140
-
141
-
142
-
143
-
144
-
145
-
146
-
147
-
148
-
149
-
150
-
151
-
152
-
153
-
154
-
155
-
156
-
157
-
158
-
159
-
160
-
161
-
162
-
163
-
164
-
165
-
166
-
167
-
168
-
169
-
170
-
171
-
172
-
173
-
174
-
175
-
176
-
177
-
178
-
179
-
180
-
181
-
182
-
183
-
184
-
185
-
186
-
187
-
188
-
189
-
190
-
191
-
192
-
193
-
194
-
195
-
196
-
197
-
198
-
199
-
200
-
201
-
202
-
203
-
204
-
205
-
206
-
207
-
208
-
209
-
210
-
211
-
212
-
213
-
214
-
215
-
216
-
217
-
218
-
219
-
220
-
221
-
222
-
223
-
224
-
225
-
226
-
227
-
228
-
229
-
230
-
231
-
232
-
233
-
234
-
235
-
236
-
237
-
238
-
239
-
240
-
241
-
242
-
243
-
244
-
245
-
246
-
247
-
248
-
249
-
250
-
251
-
252
-
253
-
254
-
255
-
256
-
257
-
258
-
259
-
260
-
261
-
262
-
263
-
264
-
265
-
266
-
267
-
268
-
269
-
270
-
271
-
272
-
273
-
274
-
275
-
276
-
277
-
278
-
279
-
280
-
281
-
282
-
283
-
284
-
285
-
286
-
287
-
288
-
289
-
290
-
291
-
292
-
293
-
294
-
295
-
296
-
297
-
298
-
299
-
300
-
301
-
302
-
303
-
304
-
305
-
306
-
307
-
308
-
309
-
310
-
311
-
312
-
313
-
314
-
315
-
316
-
317
-
318
-
319
-
320
-
321
-
322
-
323
-
324
-
325
-
326
-
327
-
328
-
329
-
330
-
331
-
332
-
333
-
334
-
335
 |
 |

Table of Contents
Comcast Corporation
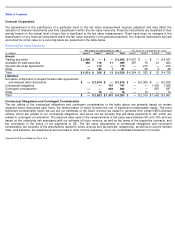
Note 6: Investments
Investment Income (Loss), Net
Fair Value Method
We classify publicly traded investments that are not accounted for under the equity method as available-for-sale (“AFS”)
or trading
securities and record them at fair value. For AFS securities, we record unrealized gains or losses resulting from changes in fair
value between measurement dates as a component of other comprehensive income (loss), except when we consider declines in
value to be other than temporary. For trading securities, we record unrealized gains or losses resulting from changes in fair value
between measurement dates as a component of investment income (loss), net. We recognize realized gains and losses associated
with our fair value method investments using the specific identification method. We classify the cash flows related to purchases of
and proceeds from the sale of trading securities based on the nature of the securities and the purpose for which they were
acquired.
December 31 (in millions)
2013
2012
Fair Value Method
$
4,345
$
4,493
Equity Method:
The Weather Channel
333
471
Hulu
187
—
Other
469
693
989
1,164
Cost Method:
AirTouch
1,553
1,538
Other
456
594
2,009
2,132
Total investments
7,343
7,789
Less: Current investments
3,573
1,464
Noncurrent investments
$
3,770
$
6,325
Year ended December 31 (in millions)
2013
2012
2011
Gains on sales and exchanges of investments, net
$
484
$
30
$
41
Investment impairment losses
(29
)
(24
)
(5
)
Unrealized gains (losses) on securities underlying prepaid forward sale agreements
1,601
1,159
192
Mark to market adjustments on derivative component of prepaid forward sale agreements and
indexed debt instruments
(1,604
)
(1,071
)
(119
)
Interest and dividend income
111
119
110
Other, net
13
6
(60
)
Investment income (loss), net
$
576
$
219
$
159
93
Comcast 2013 Annual Report on Form 10-
K