Comcast 2013 Annual Report Download - page 177
Download and view the complete annual report
Please find page 177 of the 2013 Comcast annual report below. You can navigate through the pages in the report by either clicking on the pages listed below, or by using the keyword search tool below to find specific information within the annual report.-
 1
1 -
2
-
3
-
4
-
5
-
6
-
7
-
8
-
9
-
10
-
11
-
12
-
13
-
14
-
15
-
16
-
17
-
18
-
19
-
20
-
21
-
22
-
23
-
24
-
25
-
26
-
27
-
28
-
29
-
30
-
31
-
32
-
33
-
34
-
35
-
36
-
37
-
38
-
39
-
40
-
41
-
42
-
43
-
44
-
45
-
46
-
47
-
48
-
49
-
50
-
51
-
52
-
53
-
54
-
55
-
56
-
57
-
58
-
59
-
60
-
61
-
62
-
63
-
64
-
65
-
66
-
67
-
68
-
69
-
70
-
71
-
72
-
73
-
74
-
75
-
76
-
77
-
78
-
79
-
80
-
81
-
82
-
83
-
84
-
85
-
86
-
87
-
88
-
89
-
90
-
91
-
92
-
93
-
94
-
95
-
96
-
97
-
98
-
99
-
100
-
101
-
102
-
103
-
104
-
105
-
106
-
107
-
108
-
109
-
110
-
111
-
112
-
113
-
114
-
115
-
116
-
117
-
118
-
119
-
120
-
121
-
122
-
123
-
124
-
125
-
126
-
127
-
128
-
129
-
130
-
131
-
132
-
133
-
134
-
135
-
136
-
137
-
138
-
139
-
140
-
141
-
142
-
143
-
144
-
145
-
146
-
147
-
148
-
149
-
150
-
151
-
152
-
153
-
154
-
155
-
156
-
157
-
158
-
159
-
160
-
161
-
162
-
163
-
164
-
165
-
166
-
 167
167 -
 168
168 -
 169
169 -
 170
170 -
 171
171 -
 172
172 -
 173
173 -
 174
174 -
 175
175 -
 176
176 -
 177
177 -
 178
178 -
 179
179 -
 180
180 -
 181
181 -
 182
182 -
 183
183 -
 184
184 -
 185
185 -
 186
186 -
 187
187 -
188
-
189
-
190
-
191
-
192
-
193
-
194
-
195
-
196
-
197
-
198
-
199
-
200
-
201
-
202
-
203
-
204
-
205
-
206
-
207
-
208
-
209
-
210
-
211
-
212
-
213
-
214
-
215
-
216
-
217
-
218
-
219
-
220
-
221
-
222
-
223
-
224
-
225
-
226
-
227
-
228
-
229
-
230
-
231
-
232
-
233
-
234
-
235
-
236
-
237
-
238
-
239
-
240
-
241
-
242
-
243
-
244
-
245
-
246
-
247
-
248
-
249
-
250
-
251
-
252
-
253
-
254
-
255
-
256
-
257
-
258
-
259
-
260
-
261
-
262
-
263
-
264
-
265
-
266
-
267
-
268
-
269
-
270
-
271
-
272
-
273
-
274
-
275
-
276
-
277
-
278
-
279
-
280
-
281
-
282
-
283
-
284
-
285
-
286
-
287
-
288
-
289
-
290
-
291
-
292
-
293
-
294
-
295
-
296
-
297
-
298
-
299
-
300
-
301
-
302
-
303
-
304
-
305
-
306
-
307
-
308
-
309
-
310
-
311
-
312
-
313
-
314
-
315
-
316
-
317
-
318
-
319
-
320
-
321
-
322
-
323
-
324
-
325
-
326
-
327
-
328
-
329
-
330
-
331
-
332
-
333
-
334
-
335
 |
 |

Table of Contents
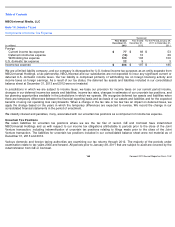
NBCUniversal Media, LLC
The table below summarizes our minimum annual programming and talent commitments and our minimum annual rental
commitments for office space and equipment under operating leases. Programming and talent commitments include acquired film
and television programming, including U.S. television rights to the future Olympic Games through 2020, Sunday Night Football
on
NBC through the 2022-
23 season, and other programming commitments, as well as our various contracts with creative talent and
employment agreements.
The table below presents our rent expense charged to operations.
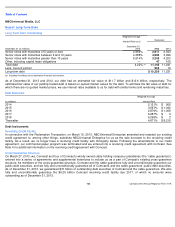
Note 18: Financial Data by Business Segment
We present our operations in four reportable business segments: Cable Networks, Broadcast Television, Filmed Entertainment and
Theme Parks. Our financial data by reportable business segment is presented in the tables below.
As of December 31, 2013 (in millions)
Programming and
Talent Commitments
Operating
Leases
2014
$
4,876
$
164
2015
$
3,182
$
133
2016
$
4,035
$
117
2017
$
2,755
$
107
2018
$
3,672
$
92
Thereafter
$
20,522
$
365
Successor
Predecessor
(in millions)
Year Ended
December 31,
2013
Year Ended
December 31,
2012
For the Period
January 29, 2011 to
December 31, 2011
For the Period
January 1, 2011 to
January 28, 2011
Rent expense
$
250
$
317
$
267
$
18
Successor (in millions)
Revenue
Operating
Income (Loss)
Before
Depreciation
and
Amortization
Depreciation
and
Amortization
Operating
Income
(Loss)
Capital
Expenditures
Assets
2013
Cable Networks
$
9,201
$
3,501
$
734
$
2,767
$
67
$
29,413
Broadcast Television
7,120
345
98
247
65
6,723
Filmed Entertainment
5,452
483
15
468
9
3,549
Theme Parks
2,235
1,004
300
704
580
6,608
Headquarters and Other
31
(588
)
264
(852
)
439
6,002
Eliminations
(389
)
(13
)
—
(
13
)
—
(
556
)
Total
$
23,650
$
4,732
$
1,411
$
3,321
$
1,160
$
51,739
Comcast 2013 Annual Report on Form 10
-
K
172
(e)(g)
(f)
(c)
(d)