Comcast 2013 Annual Report Download - page 123
Download and view the complete annual report
Please find page 123 of the 2013 Comcast annual report below. You can navigate through the pages in the report by either clicking on the pages listed below, or by using the keyword search tool below to find specific information within the annual report.
Table of Contents
Comcast Corporation
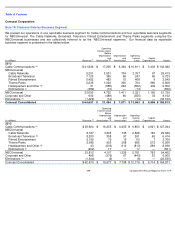
(in millions)
Revenue
Operating
Income (Loss)
Before
Depreciation
and
Amortization
Depreciation
and
Amortization
Operating
Income
(Loss)
Capital
Expenditures
2011
Cable Communications
$
37,226
$
15,288
$
6,395
$
8,893
$
4,806
NBCUniversal
Cable Networks
8,061
3,199
712
2,487
48
Broadcast Television
5,982
124
85
39
61
Filmed Entertainment
4,239
27
19
8
6
Theme Parks
1,874
830
201
629
154
Headquarters and Other
45
(484
)
168
(652
)
165
Eliminations
(941
)
(234
)
(53
)
(181
)
—
NBCUniversal
19,260
3,462
1,132
2,330
434
Corporate and Other
558
(416
)
93
(509
)
67
Eliminations
(1,202
)
23
16
7
—
Comcast Consolidated
$
55,842
$
18,357
$
7,636
$
10,721
$
5,307
(a)
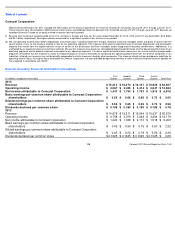
For the years ended December 31, 2013, 2012 and 2011, Cable Communications segment revenue was derived from the following sources:
2013
2012
2011
Residential:
Video
49.1
%
50.4
%
52.3
%
High
-
speed Internet
24.7
%
24.1
%
23.5
%
Voice
8.7
%
9.0
%
9.4
%
Business services
7.7
%
6.5
%
5.2
%
Advertising
5.2
%
5.8
%
5.4
%
Other
4.6
%
4.2
%
4.2
%
Total
100
%
100
%
100
%
Subscription revenue received from customers who purchase bundled services at a discounted rate is allocated proportionally to each service based on the individual
service’s price on a stand-
alone basis. Beginning in 2013, revenue from certain business customers, such as hotels, restaurants and bars, is presented in business
services revenue rather than in video revenue. Reclassifications have been made to the prior year periods to conform to this presentation.
For each of 2013, 2012 and 2011, 2.8% of Cable Communications revenue was derived from franchise and other regulatory fees.
(b)
For 2012, our Broadcast Television segment included all revenue and costs and expenses associated with our broadcast of the 2012 London Olympics, which generated
$120 million of operating income before depreciation and amortization. This amount reflects the settlement of a $237 million liability associated with the unfavorable
Olympics contract that had been recorded through the application of acquisition accounting in 2011.
(c)
For the period January 29, 2011 through June 30, 2011, we recorded Universal Orlando as an equity method investment in our consolidated results of operations.
However, our Theme Parks segment included the results of operations for Universal Orlando for the period January 29, 2011 through June 30, 2011 to reflect our
measure of operating performance for our Theme Parks segment.
(d)
NBCUniversal Headquarters and Other activities includes costs associated with overhead, allocations, personnel costs and headquarter initiatives.
(e)
Included in Eliminations are transactions that our segments enter into with one another. The most common types of transactions are the following:
•
our Cable Networks and Broadcast Television segments generate revenue by selling programming to our Cable Communications segment,
which represents a substantial majority of the revenue elimination amount
•
our Cable Communications segment generates revenue by selling advertising and by selling the use of satellite feeds to our Cable
Networks segment
•
our Filmed Entertainment and Broadcast Television segments generate revenue by licensing content to our Cable Networks segment
•
our Cable Communications segment receives incentives offered by our Cable Networks segment in connection with its distribution of the
Cable Networks
’
content that are recorded as a reduction to programming expenses
Comcast 2013 Annual Report on Form 10
-
K
118
(f)
(g)
(a)
(c)
(d)
(e)
(e)


