Comcast 2013 Annual Report Download - page 67
Download and view the complete annual report
Please find page 67 of the 2013 Comcast annual report below. You can navigate through the pages in the report by either clicking on the pages listed below, or by using the keyword search tool below to find specific information within the annual report.-
 1
1 -
2
-
3
-
4
-
5
-
6
-
7
-
8
-
9
-
10
-
11
-
12
-
13
-
14
-
15
-
16
-
17
-
18
-
19
-
20
-
21
-
22
-
23
-
24
-
25
-
26
-
27
-
28
-
29
-
30
-
31
-
32
-
33
-
34
-
35
-
36
-
37
-
38
-
39
-
40
-
41
-
42
-
43
-
44
-
45
-
46
-
47
-
48
-
49
-
50
-
51
-
52
-
53
-
54
-
55
-
56
-
 57
57 -
 58
58 -
 59
59 -
 60
60 -
 61
61 -
 62
62 -
 63
63 -
 64
64 -
 65
65 -
 66
66 -
 67
67 -
 68
68 -
 69
69 -
 70
70 -
 71
71 -
 72
72 -
 73
73 -
 74
74 -
 75
75 -
 76
76 -
 77
77 -
78
-
79
-
80
-
81
-
82
-
83
-
84
-
85
-
86
-
87
-
88
-
89
-
90
-
91
-
92
-
93
-
94
-
95
-
96
-
97
-
98
-
99
-
100
-
101
-
102
-
103
-
104
-
105
-
106
-
107
-
108
-
109
-
110
-
111
-
112
-
113
-
114
-
115
-
116
-
117
-
118
-
119
-
120
-
121
-
122
-
123
-
124
-
125
-
126
-
127
-
128
-
129
-
130
-
131
-
132
-
133
-
134
-
135
-
136
-
137
-
138
-
139
-
140
-
141
-
142
-
143
-
144
-
145
-
146
-
147
-
148
-
149
-
150
-
151
-
152
-
153
-
154
-
155
-
156
-
157
-
158
-
159
-
160
-
161
-
162
-
163
-
164
-
165
-
166
-
167
-
168
-
169
-
170
-
171
-
172
-
173
-
174
-
175
-
176
-
177
-
178
-
179
-
180
-
181
-
182
-
183
-
184
-
185
-
186
-
187
-
188
-
189
-
190
-
191
-
192
-
193
-
194
-
195
-
196
-
197
-
198
-
199
-
200
-
201
-
202
-
203
-
204
-
205
-
206
-
207
-
208
-
209
-
210
-
211
-
212
-
213
-
214
-
215
-
216
-
217
-
218
-
219
-
220
-
221
-
222
-
223
-
224
-
225
-
226
-
227
-
228
-
229
-
230
-
231
-
232
-
233
-
234
-
235
-
236
-
237
-
238
-
239
-
240
-
241
-
242
-
243
-
244
-
245
-
246
-
247
-
248
-
249
-
250
-
251
-
252
-
253
-
254
-
255
-
256
-
257
-
258
-
259
-
260
-
261
-
262
-
263
-
264
-
265
-
266
-
267
-
268
-
269
-
270
-
271
-
272
-
273
-
274
-
275
-
276
-
277
-
278
-
279
-
280
-
281
-
282
-
283
-
284
-
285
-
286
-
287
-
288
-
289
-
290
-
291
-
292
-
293
-
294
-
295
-
296
-
297
-
298
-
299
-
300
-
301
-
302
-
303
-
304
-
305
-
306
-
307
-
308
-
309
-
310
-
311
-
312
-
313
-
314
-
315
-
316
-
317
-
318
-
319
-
320
-
321
-
322
-
323
-
324
-
325
-
326
-
327
-
328
-
329
-
330
-
331
-
332
-
333
-
334
-
335
 |
 |

Table of Contents
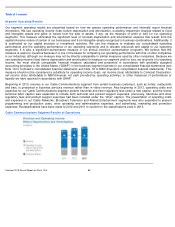
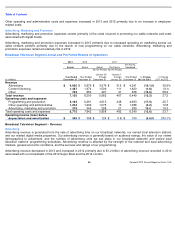
licensing revenue increased in 2012 primarily due to a higher volume of our owned and acquired films made available to licensees
in 2012, as well as an increase in the licensing of our content to digital distributors.
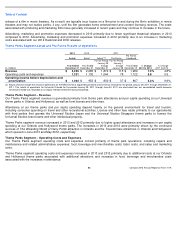
Home Entertainment
Home entertainment revenue is generated from the sale of our owned and acquired films on DVDs to retail stores, rental kiosks and
subscription by mail services, and through digital distributors. Home entertainment revenue is significantly affected by the timing
and number of our releases and their acceptance by consumers. Release dates are determined by several factors, including the
timing of the exhibition of a film in movie theaters, holiday periods and the timing of competitive releases.
Home entertainment revenue remained flat in 2013 primarily due to a decrease in the number of releases in 2013 compared to
2012 offset by the strong performance of Despicable Me 2 and Fast and Furious 6 .
Home entertainment revenue increased in
2012 primarily due to an increased number of, and improved performance of, our 2012 releases compared to our 2011 releases.
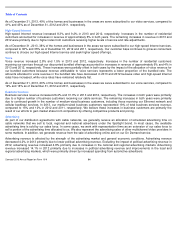
While we experienced successful DVD releases in 2013 such as Despicable Me 2 and Fast and Furious 6
, the overall DVD market
continues to experience declines due to the impact of weak economic conditions, the maturation of the standard-
definition DVD
format, piracy, and increasing shifts in consumer behavior toward digital distributors, subscription rental services and discount
rental kiosks, which generate less revenue per transaction than DVD sales.
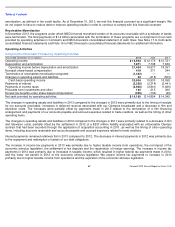
Other
We also generate revenue from producing and licensing live stage plays, distributing filmed entertainment produced by third parties
and from various digital media properties. Other revenue increased slightly in 2013 primarily due to an increase in revenue
generated from our stage plays. Other revenue decreased in 2012 primarily due to lower revenue generated from our stage plays
as a result of fewer productions.
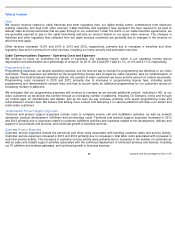
Filmed Entertainment Segment – Operating Costs and Expenses
Programming and Production
Programming and production expenses include the amortization of capitalized film production and acquisition costs, residual and
participation payments, and distribution expenses. Residual payments represent amounts payable to certain of our employees,
including freelance and temporary employees, who are represented by labor unions or guilds and are based on post-
theatrical
revenue. Participation payments are primarily based on film performance and represent contingent consideration payable to
creative talent, third parties that have entered into cofinancing agreements with us and other parties involved in the production of a
film.
Programming and production costs decreased slightly in 2013 and increased in 2012 primarily due to higher amortization of film
costs in 2012 associated with the higher cost of our 2012 film slate.
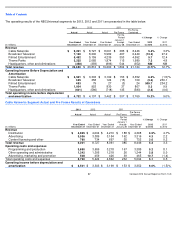
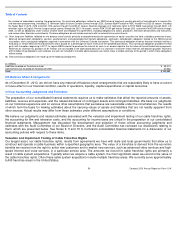
Other Operating and Administrative
Other operating and administrative expenses include salaries, employee benefits, rent and other overhead expenses.
Other operating and administrative expenses increased in 2013 primarily due to the realization of a receivable in 2012 that was
previously reserved for as uncollectible. Other operating and administrative expenses decreased in 2012 due to lower costs
associated with our stage plays business as a result of fewer productions.
Advertising, Marketing and Promotion
Advertising and marketing expenses consist primarily of expenses associated with advertising for our theatrical releases and the
marketing of DVDs. We incur significant marketing expenses before and throughout the
Comcast 2013 Annual Report on Form 10
-
K
62