Comcast 2013 Annual Report Download - page 153
Download and view the complete annual report
Please find page 153 of the 2013 Comcast annual report below. You can navigate through the pages in the report by either clicking on the pages listed below, or by using the keyword search tool below to find specific information within the annual report.-
 1
1 -
2
-
3
-
4
-
5
-
6
-
7
-
8
-
9
-
10
-
11
-
12
-
13
-
14
-
15
-
16
-
17
-
18
-
19
-
20
-
21
-
22
-
23
-
24
-
25
-
26
-
27
-
28
-
29
-
30
-
31
-
32
-
33
-
34
-
35
-
36
-
37
-
38
-
39
-
40
-
41
-
42
-
43
-
44
-
45
-
46
-
47
-
48
-
49
-
50
-
51
-
52
-
53
-
54
-
55
-
56
-
57
-
58
-
59
-
60
-
61
-
62
-
63
-
64
-
65
-
66
-
67
-
68
-
69
-
70
-
71
-
72
-
73
-
74
-
75
-
76
-
77
-
78
-
79
-
80
-
81
-
82
-
83
-
84
-
85
-
86
-
87
-
88
-
89
-
90
-
91
-
92
-
93
-
94
-
95
-
96
-
97
-
98
-
99
-
100
-
101
-
102
-
103
-
104
-
105
-
106
-
107
-
108
-
109
-
110
-
111
-
112
-
113
-
114
-
115
-
116
-
117
-
118
-
119
-
120
-
121
-
122
-
123
-
124
-
125
-
126
-
127
-
128
-
129
-
130
-
131
-
132
-
133
-
134
-
135
-
136
-
137
-
138
-
139
-
140
-
141
-
142
-
 143
143 -
 144
144 -
 145
145 -
 146
146 -
 147
147 -
 148
148 -
 149
149 -
 150
150 -
 151
151 -
 152
152 -
 153
153 -
 154
154 -
 155
155 -
 156
156 -
 157
157 -
 158
158 -
 159
159 -
 160
160 -
 161
161 -
 162
162 -
 163
163 -
164
-
165
-
166
-
167
-
168
-
169
-
170
-
171
-
172
-
173
-
174
-
175
-
176
-
177
-
178
-
179
-
180
-
181
-
182
-
183
-
184
-
185
-
186
-
187
-
188
-
189
-
190
-
191
-
192
-
193
-
194
-
195
-
196
-
197
-
198
-
199
-
200
-
201
-
202
-
203
-
204
-
205
-
206
-
207
-
208
-
209
-
210
-
211
-
212
-
213
-
214
-
215
-
216
-
217
-
218
-
219
-
220
-
221
-
222
-
223
-
224
-
225
-
226
-
227
-
228
-
229
-
230
-
231
-
232
-
233
-
234
-
235
-
236
-
237
-
238
-
239
-
240
-
241
-
242
-
243
-
244
-
245
-
246
-
247
-
248
-
249
-
250
-
251
-
252
-
253
-
254
-
255
-
256
-
257
-
258
-
259
-
260
-
261
-
262
-
263
-
264
-
265
-
266
-
267
-
268
-
269
-
270
-
271
-
272
-
273
-
274
-
275
-
276
-
277
-
278
-
279
-
280
-
281
-
282
-
283
-
284
-
285
-
286
-
287
-
288
-
289
-
290
-
291
-
292
-
293
-
294
-
295
-
296
-
297
-
298
-
299
-
300
-
301
-
302
-
303
-
304
-
305
-
306
-
307
-
308
-
309
-
310
-
311
-
312
-
313
-
314
-
315
-
316
-
317
-
318
-
319
-
320
-
321
-
322
-
323
-
324
-
325
-
326
-
327
-
328
-
329
-
330
-
331
-
332
-
333
-
334
-
335
 |
 |

Table of Contents
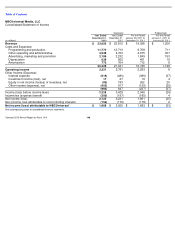
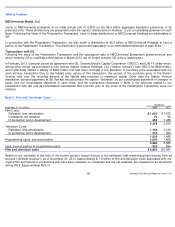
NBCUniversal Media, LLC
Consolidated Statement of Income
See accompanying notes to consolidated financial statements.
Successor
Predecessor
(in millions)
Year Ended
December 31,
2013
Year Ended
December 31,
2012
For the Period
January 29, 2011 to
December 31, 2011
For the Period
January 1, 2011 to
January 28, 2011
Revenue
$
23,650
$
23,812
$
19,028
$
1,206
Costs and Expenses:
Programming and production
11,770
12,710
9,708
711
Other operating and administrative
4,949
4,763
4,075
307
Advertising, marketing and promotion
2,199
2,232
1,849
153
Depreciation
639
562
401
19
Amortization
772
764
712
8
20,329
21,031
16,745
1,198
Operating income
3,321
2,781
2,283
8
Other Income (Expense):
Interest expense
(515
)
(480
)
(389
)
(37
)
Investment income (loss), net
17
27
19
4
Equity in net income (losses) of investees, net
(93
)
183
262
25
Other income (expense), net
(402
)
917
(129
)
(29
)
(993
)
647
(237
)
(37
)
Income (loss) before income taxes
2,328
3,428
2,046
(29
)
Income tax (expense) benefit
(206
)
(197
)
(185
)
4
Net income (loss)
2,122
3,231
1,861
(25
)
Net (income) loss attributable to noncontrolling interests
(154
)
(176
)
(178
)
2
Net income (loss) attributable to NBCUniversal
$
1,968
$
3,055
$
1,683
$
(23
)
Comcast 2013 Annual Report on Form 10
-
K
148