Comcast 2013 Annual Report Download - page 127
Download and view the complete annual report
Please find page 127 of the 2013 Comcast annual report below. You can navigate through the pages in the report by either clicking on the pages listed below, or by using the keyword search tool below to find specific information within the annual report.-
 1
1 -
2
-
3
-
4
-
5
-
6
-
7
-
8
-
9
-
10
-
11
-
12
-
13
-
14
-
15
-
16
-
17
-
18
-
19
-
20
-
21
-
22
-
23
-
24
-
25
-
26
-
27
-
28
-
29
-
30
-
31
-
32
-
33
-
34
-
35
-
36
-
37
-
38
-
39
-
40
-
41
-
42
-
43
-
44
-
45
-
46
-
47
-
48
-
49
-
50
-
51
-
52
-
53
-
54
-
55
-
56
-
57
-
58
-
59
-
60
-
61
-
62
-
63
-
64
-
65
-
66
-
67
-
68
-
69
-
70
-
71
-
72
-
73
-
74
-
75
-
76
-
77
-
78
-
79
-
80
-
81
-
82
-
83
-
84
-
85
-
86
-
87
-
88
-
89
-
90
-
91
-
92
-
93
-
94
-
95
-
96
-
97
-
98
-
99
-
100
-
101
-
102
-
103
-
104
-
105
-
106
-
107
-
108
-
109
-
110
-
111
-
112
-
113
-
114
-
115
-
116
-
 117
117 -
 118
118 -
 119
119 -
 120
120 -
 121
121 -
 122
122 -
 123
123 -
 124
124 -
 125
125 -
 126
126 -
 127
127 -
 128
128 -
 129
129 -
 130
130 -
 131
131 -
 132
132 -
 133
133 -
 134
134 -
 135
135 -
 136
136 -
 137
137 -
138
-
139
-
140
-
141
-
142
-
143
-
144
-
145
-
146
-
147
-
148
-
149
-
150
-
151
-
152
-
153
-
154
-
155
-
156
-
157
-
158
-
159
-
160
-
161
-
162
-
163
-
164
-
165
-
166
-
167
-
168
-
169
-
170
-
171
-
172
-
173
-
174
-
175
-
176
-
177
-
178
-
179
-
180
-
181
-
182
-
183
-
184
-
185
-
186
-
187
-
188
-
189
-
190
-
191
-
192
-
193
-
194
-
195
-
196
-
197
-
198
-
199
-
200
-
201
-
202
-
203
-
204
-
205
-
206
-
207
-
208
-
209
-
210
-
211
-
212
-
213
-
214
-
215
-
216
-
217
-
218
-
219
-
220
-
221
-
222
-
223
-
224
-
225
-
226
-
227
-
228
-
229
-
230
-
231
-
232
-
233
-
234
-
235
-
236
-
237
-
238
-
239
-
240
-
241
-
242
-
243
-
244
-
245
-
246
-
247
-
248
-
249
-
250
-
251
-
252
-
253
-
254
-
255
-
256
-
257
-
258
-
259
-
260
-
261
-
262
-
263
-
264
-
265
-
266
-
267
-
268
-
269
-
270
-
271
-
272
-
273
-
274
-
275
-
276
-
277
-
278
-
279
-
280
-
281
-
282
-
283
-
284
-
285
-
286
-
287
-
288
-
289
-
290
-
291
-
292
-
293
-
294
-
295
-
296
-
297
-
298
-
299
-
300
-
301
-
302
-
303
-
304
-
305
-
306
-
307
-
308
-
309
-
310
-
311
-
312
-
313
-
314
-
315
-
316
-
317
-
318
-
319
-
320
-
321
-
322
-
323
-
324
-
325
-
326
-
327
-
328
-
329
-
330
-
331
-
332
-
333
-
334
-
335
 |
 |

Table of Contents
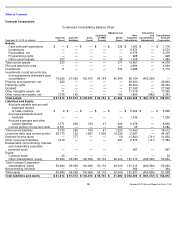
Comcast Corporation
Condensed Consolidating Balance Sheet
December 31, 2012 (in millions)
Comcast
Parent
Comcast
Holdings
CCCL
Parent
Combined
CCHMO
Parents
NBCUniversal
Media
Parent
Non-
Guarantor
Subsidiaries
Elimination
and
Consolidation
Adjustments
Consolidated
Comcast
Corporation
Assets
Cash and cash equivalents
$
—
$
—
$
—
$
—
$
5,129
$
5,822
$
—
$
10,951
Investments
—
—
—
—
—
1,464
—
1,464
Receivables, net
—
—
—
—
3
5,518
—
5,521
Programming rights
—
—
—
—
—
909
—
909
Other current assets
233
—
14
4
51
844
—
1,146
Total current assets
233
—
14
4
5,183
14,557
—
19,991
Film and television costs
—
—
—
—
—
5,054
—
5,054
Investments
—
—
—
—
529
5,796
—
6,325
Investments in and amounts due from
subsidiaries eliminated upon
consolidation
74,227
87,630
96,853
50,242
38,464
73,298
(420,714
)
—
Property and equipment, net
242
—
—
—
—
26,990
—
27,232
Franchise rights
—
—
—
—
—
59,364
—
59,364
Goodwill
—
—
—
—
—
26,985
—
26,985
Other intangible assets, net
12
—
—
—
—
17,828
—
17,840
Other noncurrent assets, net
1,130
147
1
—
152
1,650
(900
)
2,180
Total assets
$
75,844
$
87,777
$
96,868
$
50,246
$
44,328
$
231,522
$
(421,614
)
$
164,971
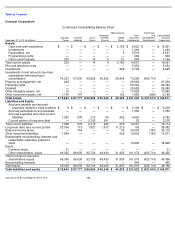
Liabilities and Equity
Accounts payable and accrued
expenses related to trade creditors
$
8
$
—
$
—
$
—
$
—
$
6,198
$
—
$
6,206
Accrued participations and residuals
—
—
—
—
—
1,350
—
1,350
Accrued expenses and other current
liabilities
1,290
275
210
54
263
4,690
—
6,782
Current portion of long
-
term debt
—
—
2,105
241
7
23
—
2,376
Total current liabilities
1,298
275
2,315
295
270
12,261
—
16,714
Long-term debt, less current portion
23,306
113
1,827
1,512
11,219
105
—
38,082
Deferred income taxes
—
754
—
—
78
30,035
(757
)
30,110
Other noncurrent liabilities
1,884
—
—
—
926
10,604
(143
)
13,271
Redeemable noncontrolling interests and
redeemable subsidiary preferred
stock
—
—
—
—
—
16,998
—
16,998
Equity:
Common stock
31
—
—
—
—
—
—
31
Other shareholders’ equity
49,325
86,635
92,726
48,439
31,835
161,079
(420,714
)
49,325
Total Comcast Corporation
shareholders
’
equity
49,356
86,635
92,726
48,439
31,835
161,079
(420,714
)
49,356
Noncontrolling interests
—
—
—
—
—
440
—
440
Total equity
49,356
86,635
92,726
48,439
31,835
161,519
(420,714
)
49,796
Total liabilities and equity
$
75,844
$
87,777
$
96,868
$
50,246
$
44,328
$
231,522
$
(421,614
)
$
164,971
Comcast 2013 Annual Report on Form 10
-
K
122