Comcast 2013 Annual Report Download - page 56
Download and view the complete annual report
Please find page 56 of the 2013 Comcast annual report below. You can navigate through the pages in the report by either clicking on the pages listed below, or by using the keyword search tool below to find specific information within the annual report.-
 1
1 -
2
-
3
-
4
-
5
-
6
-
7
-
8
-
9
-
10
-
11
-
12
-
13
-
14
-
15
-
16
-
17
-
18
-
19
-
20
-
21
-
22
-
23
-
24
-
25
-
26
-
27
-
28
-
29
-
30
-
31
-
32
-
33
-
34
-
35
-
36
-
37
-
38
-
39
-
40
-
41
-
42
-
43
-
44
-
45
-
 46
46 -
 47
47 -
 48
48 -
 49
49 -
 50
50 -
 51
51 -
 52
52 -
 53
53 -
 54
54 -
 55
55 -
 56
56 -
 57
57 -
 58
58 -
 59
59 -
 60
60 -
 61
61 -
 62
62 -
 63
63 -
 64
64 -
 65
65 -
 66
66 -
67
-
68
-
69
-
70
-
71
-
72
-
73
-
74
-
75
-
76
-
77
-
78
-
79
-
80
-
81
-
82
-
83
-
84
-
85
-
86
-
87
-
88
-
89
-
90
-
91
-
92
-
93
-
94
-
95
-
96
-
97
-
98
-
99
-
100
-
101
-
102
-
103
-
104
-
105
-
106
-
107
-
108
-
109
-
110
-
111
-
112
-
113
-
114
-
115
-
116
-
117
-
118
-
119
-
120
-
121
-
122
-
123
-
124
-
125
-
126
-
127
-
128
-
129
-
130
-
131
-
132
-
133
-
134
-
135
-
136
-
137
-
138
-
139
-
140
-
141
-
142
-
143
-
144
-
145
-
146
-
147
-
148
-
149
-
150
-
151
-
152
-
153
-
154
-
155
-
156
-
157
-
158
-
159
-
160
-
161
-
162
-
163
-
164
-
165
-
166
-
167
-
168
-
169
-
170
-
171
-
172
-
173
-
174
-
175
-
176
-
177
-
178
-
179
-
180
-
181
-
182
-
183
-
184
-
185
-
186
-
187
-
188
-
189
-
190
-
191
-
192
-
193
-
194
-
195
-
196
-
197
-
198
-
199
-
200
-
201
-
202
-
203
-
204
-
205
-
206
-
207
-
208
-
209
-
210
-
211
-
212
-
213
-
214
-
215
-
216
-
217
-
218
-
219
-
220
-
221
-
222
-
223
-
224
-
225
-
226
-
227
-
228
-
229
-
230
-
231
-
232
-
233
-
234
-
235
-
236
-
237
-
238
-
239
-
240
-
241
-
242
-
243
-
244
-
245
-
246
-
247
-
248
-
249
-
250
-
251
-
252
-
253
-
254
-
255
-
256
-
257
-
258
-
259
-
260
-
261
-
262
-
263
-
264
-
265
-
266
-
267
-
268
-
269
-
270
-
271
-
272
-
273
-
274
-
275
-
276
-
277
-
278
-
279
-
280
-
281
-
282
-
283
-
284
-
285
-
286
-
287
-
288
-
289
-
290
-
291
-
292
-
293
-
294
-
295
-
296
-
297
-
298
-
299
-
300
-
301
-
302
-
303
-
304
-
305
-
306
-
307
-
308
-
309
-
310
-
311
-
312
-
313
-
314
-
315
-
316
-
317
-
318
-
319
-
320
-
321
-
322
-
323
-
324
-
325
-
326
-
327
-
328
-
329
-
330
-
331
-
332
-
333
-
334
-
335
 |
 |

Table of Contents
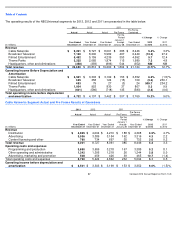
2013 Consolidated Operating Results by Segment
Consolidated Revenue
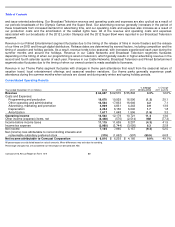
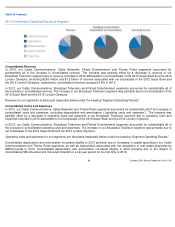
In 2013, our Cable Communications, Cable Networks, Filmed Entertainment and Theme Parks segments accounted for
substantially all of the increase in consolidated revenue. The increase was partially offset by a decrease in revenue in our
Broadcast Television segment due to revenue recorded in 2012 attributable to our broadcasts of the 2012 Super Bowl and the 2012
London Olympics. Excluding $259 million and $1.2 billion of revenue associated with our broadcasts of the 2012 Super Bowl and
the 2012 London Olympics, respectively, consolidated revenue increased 5.8% in 2013.
In 2012, our Cable Communications, Broadcast Television and Filmed Entertainment segments accounted for substantially all of
the increase in consolidated revenue. The increase in our Broadcast Television segment was primarily due to our broadcasts of the
2012 Super Bowl and the 2012 London Olympics.
Revenue for our segments is discussed separately below under the heading “Segment Operating Results.”
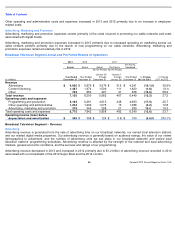
Consolidated Costs and Expenses
In 2013, our Cable Communications, Cable Networks and Theme Parks segments accounted for substantially all of the increase in
consolidated costs and expenses, excluding depreciation and amortization (“operating costs and expenses”).
The increase was
partially offset by a decrease in operating costs and expenses in our Broadcast Television segment due to operating costs and
expenses recorded in 2012 attributable to our broadcasts of the 2012 Super Bowl and the 2012 London Olympics.
In 2012, our Cable Communications, Broadcast Television and Filmed Entertainment segments accounted for substantially all of
the increase in consolidated operating costs and expenses. The increase in our Broadcast Television segment was primarily due to
our broadcasts of the 2012 Super Bowl and the 2012 London Olympics.
Operating costs and expenses for our segments are discussed separately below under the heading “Segment Operating Results.”
Consolidated depreciation and amortization increased slightly in 2013 primarily due to increases in capital spending in our Cable
Communications and Theme Parks segments, as well as depreciation associated with the acquisition of real estate properties by
NBCUniversal in 2013. Consolidated depreciation and amortization increased slightly in 2012 primarily due to the impact of
consolidating NBCUniversal and Universal Orlando for a full year period for the first time in 2012.
51
Comcast 2013 Annual Report on Form 10
-
K