Comcast 2013 Annual Report Download - page 175
Download and view the complete annual report
Please find page 175 of the 2013 Comcast annual report below. You can navigate through the pages in the report by either clicking on the pages listed below, or by using the keyword search tool below to find specific information within the annual report.-
 1
1 -
2
-
3
-
4
-
5
-
6
-
7
-
8
-
9
-
10
-
11
-
12
-
13
-
14
-
15
-
16
-
17
-
18
-
19
-
20
-
21
-
22
-
23
-
24
-
25
-
26
-
27
-
28
-
29
-
30
-
31
-
32
-
33
-
34
-
35
-
36
-
37
-
38
-
39
-
40
-
41
-
42
-
43
-
44
-
45
-
46
-
47
-
48
-
49
-
50
-
51
-
52
-
53
-
54
-
55
-
56
-
57
-
58
-
59
-
60
-
61
-
62
-
63
-
64
-
65
-
66
-
67
-
68
-
69
-
70
-
71
-
72
-
73
-
74
-
75
-
76
-
77
-
78
-
79
-
80
-
81
-
82
-
83
-
84
-
85
-
86
-
87
-
88
-
89
-
90
-
91
-
92
-
93
-
94
-
95
-
96
-
97
-
98
-
99
-
100
-
101
-
102
-
103
-
104
-
105
-
106
-
107
-
108
-
109
-
110
-
111
-
112
-
113
-
114
-
115
-
116
-
117
-
118
-
119
-
120
-
121
-
122
-
123
-
124
-
125
-
126
-
127
-
128
-
129
-
130
-
131
-
132
-
133
-
134
-
135
-
136
-
137
-
138
-
139
-
140
-
141
-
142
-
143
-
144
-
145
-
146
-
147
-
148
-
149
-
150
-
151
-
152
-
153
-
154
-
155
-
156
-
157
-
158
-
159
-
160
-
161
-
162
-
163
-
164
-
 165
165 -
 166
166 -
 167
167 -
 168
168 -
 169
169 -
 170
170 -
 171
171 -
 172
172 -
 173
173 -
 174
174 -
 175
175 -
 176
176 -
 177
177 -
 178
178 -
 179
179 -
 180
180 -
 181
181 -
 182
182 -
 183
183 -
 184
184 -
 185
185 -
186
-
187
-
188
-
189
-
190
-
191
-
192
-
193
-
194
-
195
-
196
-
197
-
198
-
199
-
200
-
201
-
202
-
203
-
204
-
205
-
206
-
207
-
208
-
209
-
210
-
211
-
212
-
213
-
214
-
215
-
216
-
217
-
218
-
219
-
220
-
221
-
222
-
223
-
224
-
225
-
226
-
227
-
228
-
229
-
230
-
231
-
232
-
233
-
234
-
235
-
236
-
237
-
238
-
239
-
240
-
241
-
242
-
243
-
244
-
245
-
246
-
247
-
248
-
249
-
250
-
251
-
252
-
253
-
254
-
255
-
256
-
257
-
258
-
259
-
260
-
261
-
262
-
263
-
264
-
265
-
266
-
267
-
268
-
269
-
270
-
271
-
272
-
273
-
274
-
275
-
276
-
277
-
278
-
279
-
280
-
281
-
282
-
283
-
284
-
285
-
286
-
287
-
288
-
289
-
290
-
291
-
292
-
293
-
294
-
295
-
296
-
297
-
298
-
299
-
300
-
301
-
302
-
303
-
304
-
305
-
306
-
307
-
308
-
309
-
310
-
311
-
312
-
313
-
314
-
315
-
316
-
317
-
318
-
319
-
320
-
321
-
322
-
323
-
324
-
325
-
326
-
327
-
328
-
329
-
330
-
331
-
332
-
333
-
334
-
335
 |
 |

Table of Contents
NBCUniversal Media, LLC
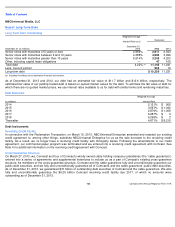
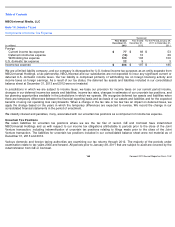
Note 15: Supplemental Financial Information
Receivables
In addition to the amounts in the table above, noncurrent receivables of $488 million and $641 million, as of December 31, 2013
and 2012, respectively, are included in other noncurrent assets, net that primarily relate to the licensing of our television and film
productions to third parties.
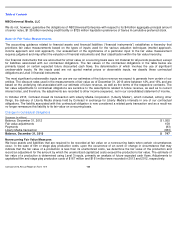
Cash Payments for Interest and Income Taxes
Other Cash Flow Information
Noncash Investing and Financing Activities
During 2013:
During 2012:
For the period January 28, 2011 through December 31, 2011:
Successor
December 31 (in millions)
2013
2012
Receivables, gross
$
5,348
$
4,381
Less: Allowance for returns and customer incentives
372
307
Less: Allowance for doubtful accounts
65
46
Receivables, net
$
4,911
$
4,028
Successor
Predecessor
(in millions)
Year Ended
December 31,
2013
Year Ended
December 31,
2012
For the Period
January 29, 2011 to
December 31,
2011
For the Period
January 1, 2011 to
January 28,
2011
Interest
$
462
$
461
$
444
$
1
Income taxes
$
205
$
169
$
161
$
493
As of January 28, 2011 (in millions)
Cash and cash equivalents at end of Predecessor period
$
470
Comcast Content Business contributed cash balances
38
Cash and cash equivalents at beginning of Successor period
$
508
•
we acquired $306 million of property and equipment and intangible assets that were accrued but unpaid
•
we entered into a capital lease transaction that resulted in an increase in property and equipment and
debt of $85 million
•
Comcast contributed the Comcast Content Business to NBCUniversal as part of the Joint Venture
transaction (see Note 3 for additional information on the Joint Venture transaction)
•
the fair value of our previously held equity interest in Universal Orlando was accounted for as noncash
consideration in the application of acquisition accounting for the Universal Orlando transaction (see Note
3 for additional information on the Universal Orlando transaction)
•
we acquired $339 million of intellectual property rights that were accrued and unpaid
Comcast 2013 Annual Report on Form 10-K
170