Comcast 2013 Annual Report Download - page 70
Download and view the complete annual report
Please find page 70 of the 2013 Comcast annual report below. You can navigate through the pages in the report by either clicking on the pages listed below, or by using the keyword search tool below to find specific information within the annual report.-
 1
1 -
2
-
3
-
4
-
5
-
6
-
7
-
8
-
9
-
10
-
11
-
12
-
13
-
14
-
15
-
16
-
17
-
18
-
19
-
20
-
21
-
22
-
23
-
24
-
25
-
26
-
27
-
28
-
29
-
30
-
31
-
32
-
33
-
34
-
35
-
36
-
37
-
38
-
39
-
40
-
41
-
42
-
43
-
44
-
45
-
46
-
47
-
48
-
49
-
50
-
51
-
52
-
53
-
54
-
55
-
56
-
57
-
58
-
59
-
 60
60 -
 61
61 -
 62
62 -
 63
63 -
 64
64 -
 65
65 -
 66
66 -
 67
67 -
 68
68 -
 69
69 -
 70
70 -
 71
71 -
 72
72 -
 73
73 -
 74
74 -
 75
75 -
 76
76 -
 77
77 -
 78
78 -
 79
79 -
 80
80 -
81
-
82
-
83
-
84
-
85
-
86
-
87
-
88
-
89
-
90
-
91
-
92
-
93
-
94
-
95
-
96
-
97
-
98
-
99
-
100
-
101
-
102
-
103
-
104
-
105
-
106
-
107
-
108
-
109
-
110
-
111
-
112
-
113
-
114
-
115
-
116
-
117
-
118
-
119
-
120
-
121
-
122
-
123
-
124
-
125
-
126
-
127
-
128
-
129
-
130
-
131
-
132
-
133
-
134
-
135
-
136
-
137
-
138
-
139
-
140
-
141
-
142
-
143
-
144
-
145
-
146
-
147
-
148
-
149
-
150
-
151
-
152
-
153
-
154
-
155
-
156
-
157
-
158
-
159
-
160
-
161
-
162
-
163
-
164
-
165
-
166
-
167
-
168
-
169
-
170
-
171
-
172
-
173
-
174
-
175
-
176
-
177
-
178
-
179
-
180
-
181
-
182
-
183
-
184
-
185
-
186
-
187
-
188
-
189
-
190
-
191
-
192
-
193
-
194
-
195
-
196
-
197
-
198
-
199
-
200
-
201
-
202
-
203
-
204
-
205
-
206
-
207
-
208
-
209
-
210
-
211
-
212
-
213
-
214
-
215
-
216
-
217
-
218
-
219
-
220
-
221
-
222
-
223
-
224
-
225
-
226
-
227
-
228
-
229
-
230
-
231
-
232
-
233
-
234
-
235
-
236
-
237
-
238
-
239
-
240
-
241
-
242
-
243
-
244
-
245
-
246
-
247
-
248
-
249
-
250
-
251
-
252
-
253
-
254
-
255
-
256
-
257
-
258
-
259
-
260
-
261
-
262
-
263
-
264
-
265
-
266
-
267
-
268
-
269
-
270
-
271
-
272
-
273
-
274
-
275
-
276
-
277
-
278
-
279
-
280
-
281
-
282
-
283
-
284
-
285
-
286
-
287
-
288
-
289
-
290
-
291
-
292
-
293
-
294
-
295
-
296
-
297
-
298
-
299
-
300
-
301
-
302
-
303
-
304
-
305
-
306
-
307
-
308
-
309
-
310
-
311
-
312
-
313
-
314
-
315
-
316
-
317
-
318
-
319
-
320
-
321
-
322
-
323
-
324
-
325
-
326
-
327
-
328
-
329
-
330
-
331
-
332
-
333
-
334
-
335
 |
 |

Table of Contents
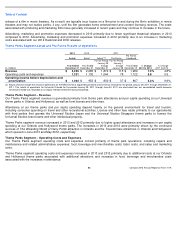
Consolidated Other Income (Expense) Items, Net
Interest Expense
Interest expense increased in 2013 primarily due to an increase in our debt outstanding, partially offset by a lower average cost of
debt. Interest expense remained flat in 2012.
Investment Income (Loss), Net
Investment income (loss), net increased in 2013 primarily due to the $443 million gain related to the sale of our investment in
Clearwire Corporation (“Clearwire”)
in July 2013. The components of investment income (loss), net in 2013, 2012 and 2011 are
presented in a table in Note 6 to Comcast’s consolidated financial statements.
Equity in Net Income (Losses) of Investees, Net
The changes in equity in net income (losses) of investees, net in 2013 and 2012 were primarily due to the $876 million of income
that was recorded in 2012 related to our portion of SpectrumCo’
s gain on sale of its advanced wireless services spectrum licenses,
as well as $142 million of total equity losses recorded in 2013 attributable to our investment in Hulu, LLC (“Hulu”).
In July 2013, we
entered into an agreement to provide capital contributions totaling $247 million to Hulu, which we had previously accounted for as a
cost method investment. This represented an agreement to provide our first capital contribution to Hulu since our interest was
acquired as part of the NBCUniversal transaction, therefore we began to apply the equity method of accounting for this investment.
The change in the method of accounting for this investment required us to recognize Hulu’
s accumulated losses from the date of
the NBCUniversal transaction through July 2013.
Other Income (Expense), Net
The changes in other income (expense), net in 2013 and 2012 were primarily due to the $1 billion gain recorded in 2012 related to
the sale of our investment in A&E Television Networks LLC (“A&E Television Networks”),
as well as an impairment of $236 million
of our equity method investment in, and loans with, a regional sports cable network based in Houston, Texas, which was recorded
in 2013.
Consolidated Income Tax Expense
Income tax expense reflects federal and state income taxes, adjustments associated with uncertain tax positions and, until the
close of the Redemption Transaction in March 2013, the partnership structure of NBCUniversal Holdings whereby income tax
expense was not recorded on the portion of its consolidated income that was attributable to GE’
s noncontrolling interest. Our
effective income tax rate in 2013, 2012 and 2011 was 35.8%, 32.3% and 37.2%, respectively. In 2013, our effective income tax rate
increased due to the Redemption Transaction in March 2013 in which we acquired GE’
s noncontrolling common equity interest in
NBCUniversal and subsequently recorded income tax expense on all of its consolidated income. In addition, our 2013 income tax
expense was reduced by $158 million due to the nontaxable portion of the increase in tax basis associated with the redemption of
Liberty Media Series A common stock in October 2013. In 2012, our effective income tax rate decreased due to proportionately
higher pretax income at NBCUniversal, which included NBCUniversal’
s gain on the sale of its equity interest in A&E Television
Networks. In addition, our 2012 income tax expense decreased by $109 million due to certain changes in state tax laws that
became
Year ended December 31 (in millions)
2013
2012
2011
Interest expense
$
(2,574
)
$
(2,521
)
$
(2,505
)
Investment income (loss), net
576
219
159
Equity in net income (losses) of investees, net
(86
)
959
(35
)
Other income (expense), net
(364
)
773
(133
)
Total
$
(2,448
)
$
(570
)
$
(2,514
)
65
Comcast 2013 Annual Report on Form 10
-
K