Comcast 2013 Annual Report Download - page 124
Download and view the complete annual report
Please find page 124 of the 2013 Comcast annual report below. You can navigate through the pages in the report by either clicking on the pages listed below, or by using the keyword search tool below to find specific information within the annual report.-
 1
1 -
2
-
3
-
4
-
5
-
6
-
7
-
8
-
9
-
10
-
11
-
12
-
13
-
14
-
15
-
16
-
17
-
18
-
19
-
20
-
21
-
22
-
23
-
24
-
25
-
26
-
27
-
28
-
29
-
30
-
31
-
32
-
33
-
34
-
35
-
36
-
37
-
38
-
39
-
40
-
41
-
42
-
43
-
44
-
45
-
46
-
47
-
48
-
49
-
50
-
51
-
52
-
53
-
54
-
55
-
56
-
57
-
58
-
59
-
60
-
61
-
62
-
63
-
64
-
65
-
66
-
67
-
68
-
69
-
70
-
71
-
72
-
73
-
74
-
75
-
76
-
77
-
78
-
79
-
80
-
81
-
82
-
83
-
84
-
85
-
86
-
87
-
88
-
89
-
90
-
91
-
92
-
93
-
94
-
95
-
96
-
97
-
98
-
99
-
100
-
101
-
102
-
103
-
104
-
105
-
106
-
107
-
108
-
109
-
110
-
111
-
112
-
113
-
 114
114 -
 115
115 -
 116
116 -
 117
117 -
 118
118 -
 119
119 -
 120
120 -
 121
121 -
 122
122 -
 123
123 -
 124
124 -
 125
125 -
 126
126 -
 127
127 -
 128
128 -
 129
129 -
 130
130 -
 131
131 -
 132
132 -
 133
133 -
 134
134 -
135
-
136
-
137
-
138
-
139
-
140
-
141
-
142
-
143
-
144
-
145
-
146
-
147
-
148
-
149
-
150
-
151
-
152
-
153
-
154
-
155
-
156
-
157
-
158
-
159
-
160
-
161
-
162
-
163
-
164
-
165
-
166
-
167
-
168
-
169
-
170
-
171
-
172
-
173
-
174
-
175
-
176
-
177
-
178
-
179
-
180
-
181
-
182
-
183
-
184
-
185
-
186
-
187
-
188
-
189
-
190
-
191
-
192
-
193
-
194
-
195
-
196
-
197
-
198
-
199
-
200
-
201
-
202
-
203
-
204
-
205
-
206
-
207
-
208
-
209
-
210
-
211
-
212
-
213
-
214
-
215
-
216
-
217
-
218
-
219
-
220
-
221
-
222
-
223
-
224
-
225
-
226
-
227
-
228
-
229
-
230
-
231
-
232
-
233
-
234
-
235
-
236
-
237
-
238
-
239
-
240
-
241
-
242
-
243
-
244
-
245
-
246
-
247
-
248
-
249
-
250
-
251
-
252
-
253
-
254
-
255
-
256
-
257
-
258
-
259
-
260
-
261
-
262
-
263
-
264
-
265
-
266
-
267
-
268
-
269
-
270
-
271
-
272
-
273
-
274
-
275
-
276
-
277
-
278
-
279
-
280
-
281
-
282
-
283
-
284
-
285
-
286
-
287
-
288
-
289
-
290
-
291
-
292
-
293
-
294
-
295
-
296
-
297
-
298
-
299
-
300
-
301
-
302
-
303
-
304
-
305
-
306
-
307
-
308
-
309
-
310
-
311
-
312
-
313
-
314
-
315
-
316
-
317
-
318
-
319
-
320
-
321
-
322
-
323
-
324
-
325
-
326
-
327
-
328
-
329
-
330
-
331
-
332
-
333
-
334
-
335
 |
 |

Table of Contents
Comcast Corporation
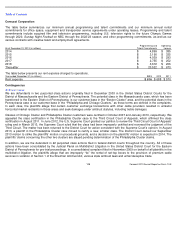
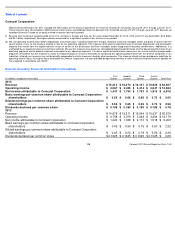
Note 20: Quarterly Financial Information (Unaudited)
NBCUniversal eliminations for 2011 included the eliminations of the results of operations for Universal Orlando for the period January 29, 2011 through June 30, 2011.
These amounts were not included in NBCUniversal’
s total and our consolidated results of operations for the period January 29, 2011 through June 30, 2011 because we
recorded Universal Orlando as an equity method investment during this period.
(f)
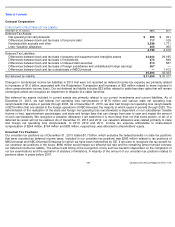
Revenue from customers located outside of the U.S., primarily in Europe and Asia, for the years ended December 31, 2013, 2012 and 2011 was $4.8 billion, $4.5 billion
and $4.1 billion, respectively. No single customer accounted for a significant amount of our revenue in any period.
(g)
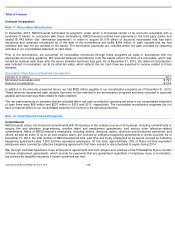
We use operating income (loss) before depreciation and amortization, excluding impairment charges related to fixed and intangible assets and gains or losses from the
sale of assets, if any, as the measure of profit or loss for our operating segments. This measure eliminates the significant level of noncash depreciation and amortization
expense that results from the capital-
intensive nature of certain of our businesses and from intangible assets recognized in business combinations. Additionally, it is
unaffected by our capital structure or investment activities. We use this measure to evaluate our consolidated operating performance and the operating performance of our
operating segments and to allocate resources and capital to our operating segments. It is also a significant performance measure in our annual incentive compensation
programs. We believe that this measure is useful to investors because it is one of the bases for comparing our operating performance with that of other companies in our
industries, although our measure may not be directly comparable to similar measures used by other companies. This measure should not be considered a substitute for
operating income (loss), net income (loss) attributable to Comcast Corporation, net cash provided by operating activities, or other measures of performance or liquidity we
have reported in accordance with GAAP.
(in millions, except per share data)
First
Quarter
Second
Quarter
Third
Quarter
Fourth
Quarter
Total Year
2013
Revenue
$
15,310
$
16,270
$
16,151
$
16,926
$
64,657
Operating income
$
3,067
$
3,435
$
3,414
$
3,647
$
13,563
Net income attributable to Comcast Corporation
$
1,437
$
1,734
$
1,732
$
1,913
$
6,816
Basic earnings per common share attributable to Comcast Corporation
shareholders
$
0.55
$
0.66
$
0.66
$
0.73
$
2.60
Diluted earnings per common share attributable to Comcast Corporation
shareholders
$
0.54
$
0.65
$
0.65
$
0.72
$
2.56
Dividends declared per common share
$
0.195
$
0.195
$
0.195
$
0.195
$
0.78
2012
Revenue
$
14,878
$
15,211
$
16,544
$
15,937
$
62,570
Operating income
$
2,758
$
3,079
$
3,048
$
3,294
$
12,179
Net income attributable to Comcast Corporation
$
1,224
$
1,348
$
2,113
$
1,518
$
6,203
Basic earnings per common share attributable to Comcast Corporation
shareholders
$
0.45
$
0.50
$
0.79
$
0.57
$
2.32
Diluted earnings per common share attributable to Comcast Corporation
shareholders
$
0.45
$
0.50
$
0.78
$
0.56
$
2.28
Dividends declared per common share
$
0.1625
$
0.1625
$
0.1625
$
0.1625
$
0.65
119
Comcast 2013 Annual Report on Form 10-
K