Comcast 2013 Annual Report Download - page 178
Download and view the complete annual report
Please find page 178 of the 2013 Comcast annual report below. You can navigate through the pages in the report by either clicking on the pages listed below, or by using the keyword search tool below to find specific information within the annual report.-
 1
1 -
2
-
3
-
4
-
5
-
6
-
7
-
8
-
9
-
10
-
11
-
12
-
13
-
14
-
15
-
16
-
17
-
18
-
19
-
20
-
21
-
22
-
23
-
24
-
25
-
26
-
27
-
28
-
29
-
30
-
31
-
32
-
33
-
34
-
35
-
36
-
37
-
38
-
39
-
40
-
41
-
42
-
43
-
44
-
45
-
46
-
47
-
48
-
49
-
50
-
51
-
52
-
53
-
54
-
55
-
56
-
57
-
58
-
59
-
60
-
61
-
62
-
63
-
64
-
65
-
66
-
67
-
68
-
69
-
70
-
71
-
72
-
73
-
74
-
75
-
76
-
77
-
78
-
79
-
80
-
81
-
82
-
83
-
84
-
85
-
86
-
87
-
88
-
89
-
90
-
91
-
92
-
93
-
94
-
95
-
96
-
97
-
98
-
99
-
100
-
101
-
102
-
103
-
104
-
105
-
106
-
107
-
108
-
109
-
110
-
111
-
112
-
113
-
114
-
115
-
116
-
117
-
118
-
119
-
120
-
121
-
122
-
123
-
124
-
125
-
126
-
127
-
128
-
129
-
130
-
131
-
132
-
133
-
134
-
135
-
136
-
137
-
138
-
139
-
140
-
141
-
142
-
143
-
144
-
145
-
146
-
147
-
148
-
149
-
150
-
151
-
152
-
153
-
154
-
155
-
156
-
157
-
158
-
159
-
160
-
161
-
162
-
163
-
164
-
165
-
166
-
167
-
 168
168 -
 169
169 -
 170
170 -
 171
171 -
 172
172 -
 173
173 -
 174
174 -
 175
175 -
 176
176 -
 177
177 -
 178
178 -
 179
179 -
 180
180 -
 181
181 -
 182
182 -
 183
183 -
 184
184 -
 185
185 -
 186
186 -
 187
187 -
 188
188 -
189
-
190
-
191
-
192
-
193
-
194
-
195
-
196
-
197
-
198
-
199
-
200
-
201
-
202
-
203
-
204
-
205
-
206
-
207
-
208
-
209
-
210
-
211
-
212
-
213
-
214
-
215
-
216
-
217
-
218
-
219
-
220
-
221
-
222
-
223
-
224
-
225
-
226
-
227
-
228
-
229
-
230
-
231
-
232
-
233
-
234
-
235
-
236
-
237
-
238
-
239
-
240
-
241
-
242
-
243
-
244
-
245
-
246
-
247
-
248
-
249
-
250
-
251
-
252
-
253
-
254
-
255
-
256
-
257
-
258
-
259
-
260
-
261
-
262
-
263
-
264
-
265
-
266
-
267
-
268
-
269
-
270
-
271
-
272
-
273
-
274
-
275
-
276
-
277
-
278
-
279
-
280
-
281
-
282
-
283
-
284
-
285
-
286
-
287
-
288
-
289
-
290
-
291
-
292
-
293
-
294
-
295
-
296
-
297
-
298
-
299
-
300
-
301
-
302
-
303
-
304
-
305
-
306
-
307
-
308
-
309
-
310
-
311
-
312
-
313
-
314
-
315
-
316
-
317
-
318
-
319
-
320
-
321
-
322
-
323
-
324
-
325
-
326
-
327
-
328
-
329
-
330
-
331
-
332
-
333
-
334
-
335
 |
 |

Table of Contents
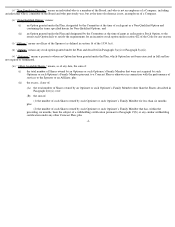
NBCUniversal Media, LLC
Successor (in millions)
Revenue
Operating
Income (Loss)
Before
Depreciation
and
Amortization
Depreciation
and
Amortization
Operating
Income
(Loss)
Capital
Expenditures
Assets
2012
Cable Networks
$
8,727
$
3,303
$
735
$
2,568
$
150
$
29,636
Broadcast Television
8,200
358
97
261
65
6,414
Filmed Entertainment
5,159
79
16
63
7
3,769
Theme Parks
2,085
953
268
685
272
6,266
Headquarters and Other
43
(603
)
210
(813
)
269
8,938
Eliminations
(402
)
17
—
17
—
(
561
)
Total
$
23,812
$
4,107
$
1,326
$
2,781
$
763
$
54,462
Successor (in millions)
Revenue
Operating
Income (Loss)
Before
Depreciation
and
Amortization
Depreciation
and
Amortization
Operating
Income
(Loss)
Capital
Expenditures
For the Period January 29, 2011 to December 31, 2011
Cable Networks
$
7,829
$
3,133
$
694
$
2,439
$
46
Broadcast Television
5,982
124
85
39
61
Filmed Entertainment
4,239
27
19
8
6
Theme Parks
1,874
830
201
629
154
Headquarters and Other
45
(484
)
114
(598
)
165
Eliminations
(941
)
(234
)
—
(
234
)
—
Total
$
19,028
$
3,396
$
1,113
$
2,283
$
432
Predecessor (in millions)
Revenue
Operating
Income (Loss)
Before
Depreciation
and
Amortization
Depreciation
and
Amortization
Operating
Income
(Loss)
Capital
Expenditures
For the Period January 1, 2011 to
January 28, 2011
Cable Networks
$
385
$
145
$
3
$
142
$
1
Broadcast Television
468
(18
)
6
(24
)
1
Filmed Entertainment
353
1
2
(1
)
1
Theme Parks
115
37
14
23
9
Headquarters and Other
5
(99
)
2
(101
)
4
Eliminations
(120
)
(31
)
—
(
31
)
—
Total
$
1,206
$
35
$
27
$
8
$
16
(a)
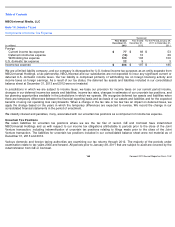
For 2012, our Broadcast Television segment included all revenue and costs and expenses associated with our broadcast of the 2012 London Olympics, which generated
$120 million of operating income before depreciation and amortization. This amount reflects the settlement of a $237 million liability associated with the unfavorable
Olympics contract that had been recorded through the
application of acquisition accounting in 2011.
(b)
For the periods January 1, 2011 through January 28, 2011 and January 29, 2011 through June 30, 2011, our Theme Parks segment included the results of operations for
Universal Orlando to reflect our measure of operating performance for our Theme Parks segment.
173
Comcast 2013 Annual Report on Form 10-
K
(e)(g)
(f)
(a)
(c)
(d)
(e)(g) (f)
(b)
(c)
(d)
(e)(g) (f)
(b)
(c)
(d)