Comcast 2013 Annual Report Download - page 64
Download and view the complete annual report
Please find page 64 of the 2013 Comcast annual report below. You can navigate through the pages in the report by either clicking on the pages listed below, or by using the keyword search tool below to find specific information within the annual report.-
 1
1 -
2
-
3
-
4
-
5
-
6
-
7
-
8
-
9
-
10
-
11
-
12
-
13
-
14
-
15
-
16
-
17
-
18
-
19
-
20
-
21
-
22
-
23
-
24
-
25
-
26
-
27
-
28
-
29
-
30
-
31
-
32
-
33
-
34
-
35
-
36
-
37
-
38
-
39
-
40
-
41
-
42
-
43
-
44
-
45
-
46
-
47
-
48
-
49
-
50
-
51
-
52
-
53
-
 54
54 -
 55
55 -
 56
56 -
 57
57 -
 58
58 -
 59
59 -
 60
60 -
 61
61 -
 62
62 -
 63
63 -
 64
64 -
 65
65 -
 66
66 -
 67
67 -
 68
68 -
 69
69 -
 70
70 -
 71
71 -
 72
72 -
 73
73 -
 74
74 -
75
-
76
-
77
-
78
-
79
-
80
-
81
-
82
-
83
-
84
-
85
-
86
-
87
-
88
-
89
-
90
-
91
-
92
-
93
-
94
-
95
-
96
-
97
-
98
-
99
-
100
-
101
-
102
-
103
-
104
-
105
-
106
-
107
-
108
-
109
-
110
-
111
-
112
-
113
-
114
-
115
-
116
-
117
-
118
-
119
-
120
-
121
-
122
-
123
-
124
-
125
-
126
-
127
-
128
-
129
-
130
-
131
-
132
-
133
-
134
-
135
-
136
-
137
-
138
-
139
-
140
-
141
-
142
-
143
-
144
-
145
-
146
-
147
-
148
-
149
-
150
-
151
-
152
-
153
-
154
-
155
-
156
-
157
-
158
-
159
-
160
-
161
-
162
-
163
-
164
-
165
-
166
-
167
-
168
-
169
-
170
-
171
-
172
-
173
-
174
-
175
-
176
-
177
-
178
-
179
-
180
-
181
-
182
-
183
-
184
-
185
-
186
-
187
-
188
-
189
-
190
-
191
-
192
-
193
-
194
-
195
-
196
-
197
-
198
-
199
-
200
-
201
-
202
-
203
-
204
-
205
-
206
-
207
-
208
-
209
-
210
-
211
-
212
-
213
-
214
-
215
-
216
-
217
-
218
-
219
-
220
-
221
-
222
-
223
-
224
-
225
-
226
-
227
-
228
-
229
-
230
-
231
-
232
-
233
-
234
-
235
-
236
-
237
-
238
-
239
-
240
-
241
-
242
-
243
-
244
-
245
-
246
-
247
-
248
-
249
-
250
-
251
-
252
-
253
-
254
-
255
-
256
-
257
-
258
-
259
-
260
-
261
-
262
-
263
-
264
-
265
-
266
-
267
-
268
-
269
-
270
-
271
-
272
-
273
-
274
-
275
-
276
-
277
-
278
-
279
-
280
-
281
-
282
-
283
-
284
-
285
-
286
-
287
-
288
-
289
-
290
-
291
-
292
-
293
-
294
-
295
-
296
-
297
-
298
-
299
-
300
-
301
-
302
-
303
-
304
-
305
-
306
-
307
-
308
-
309
-
310
-
311
-
312
-
313
-
314
-
315
-
316
-
317
-
318
-
319
-
320
-
321
-
322
-
323
-
324
-
325
-
326
-
327
-
328
-
329
-
330
-
331
-
332
-
333
-
334
-
335
 |
 |

Table of Contents
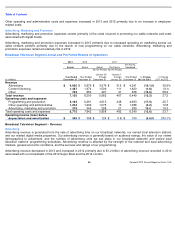
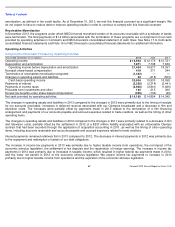
Other operating and administrative costs and expenses increased in 2013 and 2012 primarily due to an increase in employee-
related costs.
Advertising, Marketing and Promotion
Advertising, marketing and promotion expenses consist primarily of the costs incurred in promoting our cable networks and costs
associated with digital media.
Advertising, marketing and promotion expenses increased in 2013 primarily due to increased spending on marketing across our
cable network portfolio primarily due to the launch of new programming on our cable networks. Advertising, marketing and
promotion expenses remained relatively flat in 2012.
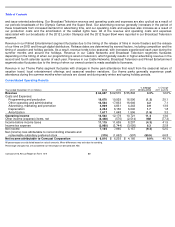
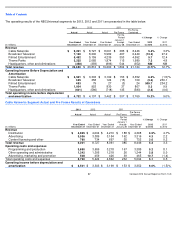
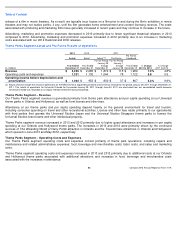
Broadcast Television Segment Actual and Pro Forma Results of Operations
Broadcast Television Segment – Revenue
Advertising
Advertising revenue is generated from the sale of advertising time on our broadcast networks, our owned local television stations
and our related digital media properties. Our advertising revenue is generally based on audience ratings, the value of our viewer
demographics to advertisers, and the number of advertising units we can place in our broadcast networks’
and owned local
television stations’
programming schedules. Advertising revenue is affected by the strength of the national and local advertising
markets, general economic conditions, and the success and ratings of our programming.
Advertising revenue decreased in 2013 and increased in 2012 primarily due to $1.2 billion of advertising revenue recorded in 2012
associated with our broadcasts of the 2012 Super Bowl and the 2012 London
2013
2012
2011
Actual
Actual
Actual
Pro Forma
Pro Forma
Combined
(in millions)
Year Ended
December 31
Year Ended
December 31
For the Period
January 29
through
December 31
For the Period
January 1
through
January 28
Year Ended
December 31
% Change
2012 to 2013
% Change
2011 to 2012
Revenue
Advertising
$
4,930
$
5,876
$
3,976
$
315
$
4,291
(16.1
)%
36.9
%
Content licensing
1,447
1,474
1,509
111
1,620
(1.8
)
(9.1
)
Other
743
850
497
41
538
(12.6
)
58.2
Total revenue
7,120
8,200
5,982
467
6,449
(13.2
)
27.2
Operating costs and expenses
Programming and production
5,192
6,291
4,515
448
4,963
(17.5
)
26.7
Other operating and administrative
1,204
1,206
1,075
13
1,088
(0.2
)
10.8
Advertising, marketing and promotion
379
345
268
21
289
10.0
19.3
Total operating costs and expenses
6,775
7,842
5,858
482
6,340
(13.6
)
23.7
Operating income (loss) before
depreciation and amortization
$
345
$
358
$
124
$
(15
)
$
109
(3.6
)%
230.1
%
59
Comcast 2013 Annual Report on Form 10
-
K