Comcast 2013 Annual Report Download - page 68
Download and view the complete annual report
Please find page 68 of the 2013 Comcast annual report below. You can navigate through the pages in the report by either clicking on the pages listed below, or by using the keyword search tool below to find specific information within the annual report.-
 1
1 -
2
-
3
-
4
-
5
-
6
-
7
-
8
-
9
-
10
-
11
-
12
-
13
-
14
-
15
-
16
-
17
-
18
-
19
-
20
-
21
-
22
-
23
-
24
-
25
-
26
-
27
-
28
-
29
-
30
-
31
-
32
-
33
-
34
-
35
-
36
-
37
-
38
-
39
-
40
-
41
-
42
-
43
-
44
-
45
-
46
-
47
-
48
-
49
-
50
-
51
-
52
-
53
-
54
-
55
-
56
-
57
-
 58
58 -
 59
59 -
 60
60 -
 61
61 -
 62
62 -
 63
63 -
 64
64 -
 65
65 -
 66
66 -
 67
67 -
 68
68 -
 69
69 -
 70
70 -
 71
71 -
 72
72 -
 73
73 -
 74
74 -
 75
75 -
 76
76 -
 77
77 -
 78
78 -
79
-
80
-
81
-
82
-
83
-
84
-
85
-
86
-
87
-
88
-
89
-
90
-
91
-
92
-
93
-
94
-
95
-
96
-
97
-
98
-
99
-
100
-
101
-
102
-
103
-
104
-
105
-
106
-
107
-
108
-
109
-
110
-
111
-
112
-
113
-
114
-
115
-
116
-
117
-
118
-
119
-
120
-
121
-
122
-
123
-
124
-
125
-
126
-
127
-
128
-
129
-
130
-
131
-
132
-
133
-
134
-
135
-
136
-
137
-
138
-
139
-
140
-
141
-
142
-
143
-
144
-
145
-
146
-
147
-
148
-
149
-
150
-
151
-
152
-
153
-
154
-
155
-
156
-
157
-
158
-
159
-
160
-
161
-
162
-
163
-
164
-
165
-
166
-
167
-
168
-
169
-
170
-
171
-
172
-
173
-
174
-
175
-
176
-
177
-
178
-
179
-
180
-
181
-
182
-
183
-
184
-
185
-
186
-
187
-
188
-
189
-
190
-
191
-
192
-
193
-
194
-
195
-
196
-
197
-
198
-
199
-
200
-
201
-
202
-
203
-
204
-
205
-
206
-
207
-
208
-
209
-
210
-
211
-
212
-
213
-
214
-
215
-
216
-
217
-
218
-
219
-
220
-
221
-
222
-
223
-
224
-
225
-
226
-
227
-
228
-
229
-
230
-
231
-
232
-
233
-
234
-
235
-
236
-
237
-
238
-
239
-
240
-
241
-
242
-
243
-
244
-
245
-
246
-
247
-
248
-
249
-
250
-
251
-
252
-
253
-
254
-
255
-
256
-
257
-
258
-
259
-
260
-
261
-
262
-
263
-
264
-
265
-
266
-
267
-
268
-
269
-
270
-
271
-
272
-
273
-
274
-
275
-
276
-
277
-
278
-
279
-
280
-
281
-
282
-
283
-
284
-
285
-
286
-
287
-
288
-
289
-
290
-
291
-
292
-
293
-
294
-
295
-
296
-
297
-
298
-
299
-
300
-
301
-
302
-
303
-
304
-
305
-
306
-
307
-
308
-
309
-
310
-
311
-
312
-
313
-
314
-
315
-
316
-
317
-
318
-
319
-
320
-
321
-
322
-
323
-
324
-
325
-
326
-
327
-
328
-
329
-
330
-
331
-
332
-
333
-
334
-
335
 |
 |

Table of Contents
release of a film in movie theaters. As a result, we typically incur losses on a film prior to and during the film’
s exhibition in movie
theaters and may not realize profits, if any, until the film generates home entertainment and content licensing revenue. The costs
associated with producing and marketing films have generally increased in recent years and may continue to increase in the future.
Advertising, marketing and promotion expenses decreased in 2013 primarily due to fewer significant theatrical releases in 2013
compared to 2012. Advertising, marketing and promotion expenses increased in 2012 primarily due to an increase in marketing
costs associated with our 2012 theatrical and DVD releases.
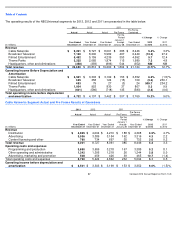
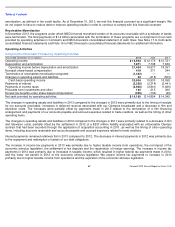
Theme Parks Segment Actual and Pro Forma Results of Operations
Theme Parks Segment – Revenue
Our Theme Parks segment revenue is generated primarily from theme park attendance and per capita spending at our Universal
theme parks in Orlando and Hollywood, as well as from license and other fees.
Attendance at our theme parks and per capita spending depend heavily on the general environment for travel and tourism,
including consumer spending on travel and other recreational activities. License and other fees relate primarily to our agreements
with third parties that operate the Universal Studios Japan and the Universal Studios Singapore theme parks to license the
Universal Studios brand name and other intellectual property.
Theme Parks segment revenue increased in 2013 and 2012 primarily due to higher guest attendance and increases in per capita
spending at our Orlando and Hollywood theme parks. The increases in 2013 and 2012 were primarily driven by the continued
success of The Wizarding World of Harry Potter attraction in Orlando and the Transformers
attractions in Orlando and Hollywood,
which opened in June 2013 and May 2012, respectively.
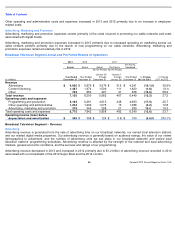
Theme Parks Segment – Operating Costs and Expenses
Our Theme Parks segment operating costs and expenses consist primarily of theme park operations, including repairs and
maintenance and related administrative expenses; food, beverage and merchandise costs; labor costs; and sales and marketing
costs.
Theme Parks segment operating costs and expenses increased in 2013 and 2012 primarily due to additional costs at our Orlando
and Hollywood theme parks associated with additional attractions and increases in food, beverage and merchandise costs
associated with the increases in attendance.
2013
2012
2011
Actual
Actual
Actual
Pro Forma
Pro Forma
Combined
(in millions)
Year Ended
December 31
Year Ended
December 31
For the Period
January 29
through
December 31
For the Period
January 1
through
January 28
Year Ended
December 31
% Change
2012 to 2013
% Change
2011 to 2012
Revenue
$
2,235
$
2,085
$
1,874
$
115
$
1,989
7.2
%
4.8
%
Operating costs and expenses
1,231
1,132
1,044
78
1,122
8.8
0.9
Operating income before depreciation and
amortization
$
1,004
$
953
$
830
$
37
$
867
5.3
%
9.9
%
(a)
Actual amounts include the results of operations for the NBCUniversal acquired businesses and Universal Orlando for the period January 29, 2011 through December 31,
2011. The results of operations for Universal Orlando for the period January 29, 2011 through June 30, 2011 are eliminated from our consolidated results because
Universal Orlando was recorded as an equity method investment during that period.
63
Comcast 2013 Annual Report on Form 10
-
K
(a)