Comcast 2013 Annual Report Download - page 169
Download and view the complete annual report
Please find page 169 of the 2013 Comcast annual report below. You can navigate through the pages in the report by either clicking on the pages listed below, or by using the keyword search tool below to find specific information within the annual report.-
 1
1 -
2
-
3
-
4
-
5
-
6
-
7
-
8
-
9
-
10
-
11
-
12
-
13
-
14
-
15
-
16
-
17
-
18
-
19
-
20
-
21
-
22
-
23
-
24
-
25
-
26
-
27
-
28
-
29
-
30
-
31
-
32
-
33
-
34
-
35
-
36
-
37
-
38
-
39
-
40
-
41
-
42
-
43
-
44
-
45
-
46
-
47
-
48
-
49
-
50
-
51
-
52
-
53
-
54
-
55
-
56
-
57
-
58
-
59
-
60
-
61
-
62
-
63
-
64
-
65
-
66
-
67
-
68
-
69
-
70
-
71
-
72
-
73
-
74
-
75
-
76
-
77
-
78
-
79
-
80
-
81
-
82
-
83
-
84
-
85
-
86
-
87
-
88
-
89
-
90
-
91
-
92
-
93
-
94
-
95
-
96
-
97
-
98
-
99
-
100
-
101
-
102
-
103
-
104
-
105
-
106
-
107
-
108
-
109
-
110
-
111
-
112
-
113
-
114
-
115
-
116
-
117
-
118
-
119
-
120
-
121
-
122
-
123
-
124
-
125
-
126
-
127
-
128
-
129
-
130
-
131
-
132
-
133
-
134
-
135
-
136
-
137
-
138
-
139
-
140
-
141
-
142
-
143
-
144
-
145
-
146
-
147
-
148
-
149
-
150
-
151
-
152
-
153
-
154
-
155
-
156
-
157
-
158
-
 159
159 -
 160
160 -
 161
161 -
 162
162 -
 163
163 -
 164
164 -
 165
165 -
 166
166 -
 167
167 -
 168
168 -
 169
169 -
 170
170 -
 171
171 -
 172
172 -
 173
173 -
 174
174 -
 175
175 -
 176
176 -
 177
177 -
 178
178 -
 179
179 -
180
-
181
-
182
-
183
-
184
-
185
-
186
-
187
-
188
-
189
-
190
-
191
-
192
-
193
-
194
-
195
-
196
-
197
-
198
-
199
-
200
-
201
-
202
-
203
-
204
-
205
-
206
-
207
-
208
-
209
-
210
-
211
-
212
-
213
-
214
-
215
-
216
-
217
-
218
-
219
-
220
-
221
-
222
-
223
-
224
-
225
-
226
-
227
-
228
-
229
-
230
-
231
-
232
-
233
-
234
-
235
-
236
-
237
-
238
-
239
-
240
-
241
-
242
-
243
-
244
-
245
-
246
-
247
-
248
-
249
-
250
-
251
-
252
-
253
-
254
-
255
-
256
-
257
-
258
-
259
-
260
-
261
-
262
-
263
-
264
-
265
-
266
-
267
-
268
-
269
-
270
-
271
-
272
-
273
-
274
-
275
-
276
-
277
-
278
-
279
-
280
-
281
-
282
-
283
-
284
-
285
-
286
-
287
-
288
-
289
-
290
-
291
-
292
-
293
-
294
-
295
-
296
-
297
-
298
-
299
-
300
-
301
-
302
-
303
-
304
-
305
-
306
-
307
-
308
-
309
-
310
-
311
-
312
-
313
-
314
-
315
-
316
-
317
-
318
-
319
-
320
-
321
-
322
-
323
-
324
-
325
-
326
-
327
-
328
-
329
-
330
-
331
-
332
-
333
-
334
-
335
 |
 |

Table of Contents
NBCUniversal Media, LLC
We do not, however, guarantee the obligations of NBCUniversal Enterprise with respect to its $4 billion aggregate principal amount
of senior notes, $1.35 billion revolving credit facility or $725 million liquidation preference of Series A cumulative preferred stock.
Note 10: Fair Value Measurements
The accounting guidance related to financial assets and financial liabilities (“financial instruments”)
establishes a hierarchy that
prioritizes fair value measurements based on the types of inputs used for the various valuation techniques (market approach,
income approach and cost approach). Our assessment of the significance of a particular input to the fair value measurement
requires judgment and may affect the valuation of financial instruments and their classification within the fair value hierarchy.
Our financial instruments that are accounted for at fair value on a recurring basis were not material for all periods presented, except
for liabilities associated with our contractual obligations. The fair values of the contractual obligations in the table below are
primarily based on certain expected future discounted cash flows, the determination of which involves the use of significant
unobservable inputs. As the inputs used are not quoted market prices or observable inputs, we classify these contractual
obligations as Level 3 financial instruments.
The most significant unobservable inputs we use are our estimates of the future revenue we expect to generate from certain of our
entities. The discount rates used in the measurements of fair value as of December 31, 2013 were between 12% and 13% and are
based on the underlying risk associated with our estimate of future revenue, as well as the terms of the respective contracts. The
fair value adjustments to contractual obligations are sensitive to the assumptions related to future revenue, as well as to current
interest rates, and therefore, the adjustments are recorded to other income (expense), net in our consolidated statement of income.
In October 2013, Comcast closed its transaction with Liberty Media Corporation (“Liberty Media”),
which included, among other
things, the delivery of Liberty Media shares held by Comcast in exchange for Liberty Media’
s interests in one of our contractual
obligations. The liability associated with this contractual obligation is now considered a related party transaction and as a result we
no longer remeasure this liability to its fair value on a recurring basis.
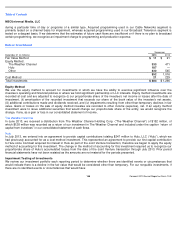
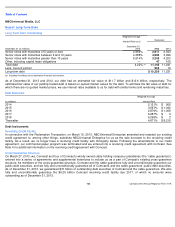
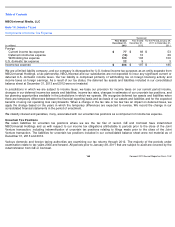
Changes in Contractual Obligations
Nonrecurring Fair Value Measures
We have assets and liabilities that are required to be recorded at fair value on a nonrecurring basis when certain circumstances
occur. In the case of film or stage play production costs, upon the occurrence of an event or change in circumstance that may
indicate that the fair value of a production is less than its unamortized costs, we determine the fair value of the production and
record an adjustment for the amount by which the unamortized capitalized costs exceed the production’
s fair value. The estimate of
fair value of a production is determined using Level 3 inputs, primarily an analysis of future expected cash flows. Adjustments to
capitalized film and stage play production costs of $167 million and $161 million were recorded in 2013 and 2012, respectively.
Successor (in millions)
Balance, December 31, 2012
$
1,055
Fair value adjustments
158
Payments
(83
)
Liberty Media transaction
(383
)
Balance, December 31, 2013
$
747
Comcast 2013 Annual Report on Form 10
-
K
164