Comcast 2013 Annual Report Download - page 57
Download and view the complete annual report
Please find page 57 of the 2013 Comcast annual report below. You can navigate through the pages in the report by either clicking on the pages listed below, or by using the keyword search tool below to find specific information within the annual report.-
 1
1 -
2
-
3
-
4
-
5
-
6
-
7
-
8
-
9
-
10
-
11
-
12
-
13
-
14
-
15
-
16
-
17
-
18
-
19
-
20
-
21
-
22
-
23
-
24
-
25
-
26
-
27
-
28
-
29
-
30
-
31
-
32
-
33
-
34
-
35
-
36
-
37
-
38
-
39
-
40
-
41
-
42
-
43
-
44
-
45
-
46
-
 47
47 -
 48
48 -
 49
49 -
 50
50 -
 51
51 -
 52
52 -
 53
53 -
 54
54 -
 55
55 -
 56
56 -
 57
57 -
 58
58 -
 59
59 -
 60
60 -
 61
61 -
 62
62 -
 63
63 -
 64
64 -
 65
65 -
 66
66 -
 67
67 -
68
-
69
-
70
-
71
-
72
-
73
-
74
-
75
-
76
-
77
-
78
-
79
-
80
-
81
-
82
-
83
-
84
-
85
-
86
-
87
-
88
-
89
-
90
-
91
-
92
-
93
-
94
-
95
-
96
-
97
-
98
-
99
-
100
-
101
-
102
-
103
-
104
-
105
-
106
-
107
-
108
-
109
-
110
-
111
-
112
-
113
-
114
-
115
-
116
-
117
-
118
-
119
-
120
-
121
-
122
-
123
-
124
-
125
-
126
-
127
-
128
-
129
-
130
-
131
-
132
-
133
-
134
-
135
-
136
-
137
-
138
-
139
-
140
-
141
-
142
-
143
-
144
-
145
-
146
-
147
-
148
-
149
-
150
-
151
-
152
-
153
-
154
-
155
-
156
-
157
-
158
-
159
-
160
-
161
-
162
-
163
-
164
-
165
-
166
-
167
-
168
-
169
-
170
-
171
-
172
-
173
-
174
-
175
-
176
-
177
-
178
-
179
-
180
-
181
-
182
-
183
-
184
-
185
-
186
-
187
-
188
-
189
-
190
-
191
-
192
-
193
-
194
-
195
-
196
-
197
-
198
-
199
-
200
-
201
-
202
-
203
-
204
-
205
-
206
-
207
-
208
-
209
-
210
-
211
-
212
-
213
-
214
-
215
-
216
-
217
-
218
-
219
-
220
-
221
-
222
-
223
-
224
-
225
-
226
-
227
-
228
-
229
-
230
-
231
-
232
-
233
-
234
-
235
-
236
-
237
-
238
-
239
-
240
-
241
-
242
-
243
-
244
-
245
-
246
-
247
-
248
-
249
-
250
-
251
-
252
-
253
-
254
-
255
-
256
-
257
-
258
-
259
-
260
-
261
-
262
-
263
-
264
-
265
-
266
-
267
-
268
-
269
-
270
-
271
-
272
-
273
-
274
-
275
-
276
-
277
-
278
-
279
-
280
-
281
-
282
-
283
-
284
-
285
-
286
-
287
-
288
-
289
-
290
-
291
-
292
-
293
-
294
-
295
-
296
-
297
-
298
-
299
-
300
-
301
-
302
-
303
-
304
-
305
-
306
-
307
-
308
-
309
-
310
-
311
-
312
-
313
-
314
-
315
-
316
-
317
-
318
-
319
-
320
-
321
-
322
-
323
-
324
-
325
-
326
-
327
-
328
-
329
-
330
-
331
-
332
-
333
-
334
-
335
 |
 |
Table of Contents
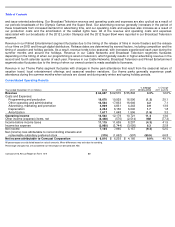
Segment Operating Results
Our segment operating results are presented based on how we assess operating performance and internally report financial
information. We use operating income (loss) before depreciation and amortization, excluding impairment charges related to fixed
and intangible assets and gains or losses from the sale of assets, if any, as the measure of profit or loss for our operating
segments. This measure eliminates the significant level of noncash depreciation and amortization expense that results from the
capital-
intensive nature of certain of our businesses and from intangible assets recognized in business combinations. Additionally, it
is unaffected by our capital structure or investment activities. We use this measure to evaluate our consolidated operating
performance and the operating performance of our operating segments and to allocate resources and capital to our operating
segments. It is also a significant performance measure in our annual incentive compensation programs. We believe that this
measure is useful to investors because it is one of the bases for comparing our operating performance with that of other companies
in our industries, although our measure may not be directly comparable to similar measures used by other companies. Because we
use operating income (loss) before depreciation and amortization to measure our segment profit or loss, we reconcile it to operating
income, the most directly comparable financial measure calculated and presented in accordance with generally accepted
accounting principles in the United States (“GAAP”)
in the business segment footnote to our consolidated financial statements (see
Note 19 to Comcast’s consolidated financial statements and Note 18 to NBCUniversal’
s consolidated financial statements). This
measure should not be considered a substitute for operating income (loss), net income (loss) attributable to Comcast Corporation,
net income (loss) attributable to NBCUniversal, net cash provided by operating activities, or other measures of performance or
liquidity we have reported in accordance with GAAP.
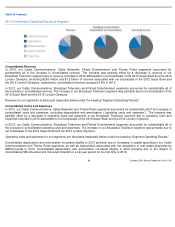
Beginning in 2013, revenue in our Cable Communications segment from certain business customers, such as hotels, restaurants
and bars, is presented in business services revenue rather than in video revenue. Also beginning in 2013, operating costs and
expenses for our Cable Communications segment present franchise and other regulatory fees under a new caption, and the former
technical labor caption was expanded to include both technical and product support expenses; previously, franchise and other
regulatory fees and product support expenses had been included under the “other”
caption. The presentation of operating costs
and expenses in our Cable Networks, Broadcast Television and Filmed Entertainment segments was also expanded to present
programming and production costs, other operating and administrative expenses, and advertising, marketing and promotion
expenses. Reclassifications have been made to 2012 and 2011 to conform to the classifications used in 2013.
Cable Communications Segment Results of Operations
Comcast 2013 Annual Report on Form 10-K
52