Comcast 2013 Annual Report Download - page 72
Download and view the complete annual report
Please find page 72 of the 2013 Comcast annual report below. You can navigate through the pages in the report by either clicking on the pages listed below, or by using the keyword search tool below to find specific information within the annual report.-
 1
1 -
2
-
3
-
4
-
5
-
6
-
7
-
8
-
9
-
10
-
11
-
12
-
13
-
14
-
15
-
16
-
17
-
18
-
19
-
20
-
21
-
22
-
23
-
24
-
25
-
26
-
27
-
28
-
29
-
30
-
31
-
32
-
33
-
34
-
35
-
36
-
37
-
38
-
39
-
40
-
41
-
42
-
43
-
44
-
45
-
46
-
47
-
48
-
49
-
50
-
51
-
52
-
53
-
54
-
55
-
56
-
57
-
58
-
59
-
60
-
61
-
 62
62 -
 63
63 -
 64
64 -
 65
65 -
 66
66 -
 67
67 -
 68
68 -
 69
69 -
 70
70 -
 71
71 -
 72
72 -
 73
73 -
 74
74 -
 75
75 -
 76
76 -
 77
77 -
 78
78 -
 79
79 -
 80
80 -
 81
81 -
 82
82 -
83
-
84
-
85
-
86
-
87
-
88
-
89
-
90
-
91
-
92
-
93
-
94
-
95
-
96
-
97
-
98
-
99
-
100
-
101
-
102
-
103
-
104
-
105
-
106
-
107
-
108
-
109
-
110
-
111
-
112
-
113
-
114
-
115
-
116
-
117
-
118
-
119
-
120
-
121
-
122
-
123
-
124
-
125
-
126
-
127
-
128
-
129
-
130
-
131
-
132
-
133
-
134
-
135
-
136
-
137
-
138
-
139
-
140
-
141
-
142
-
143
-
144
-
145
-
146
-
147
-
148
-
149
-
150
-
151
-
152
-
153
-
154
-
155
-
156
-
157
-
158
-
159
-
160
-
161
-
162
-
163
-
164
-
165
-
166
-
167
-
168
-
169
-
170
-
171
-
172
-
173
-
174
-
175
-
176
-
177
-
178
-
179
-
180
-
181
-
182
-
183
-
184
-
185
-
186
-
187
-
188
-
189
-
190
-
191
-
192
-
193
-
194
-
195
-
196
-
197
-
198
-
199
-
200
-
201
-
202
-
203
-
204
-
205
-
206
-
207
-
208
-
209
-
210
-
211
-
212
-
213
-
214
-
215
-
216
-
217
-
218
-
219
-
220
-
221
-
222
-
223
-
224
-
225
-
226
-
227
-
228
-
229
-
230
-
231
-
232
-
233
-
234
-
235
-
236
-
237
-
238
-
239
-
240
-
241
-
242
-
243
-
244
-
245
-
246
-
247
-
248
-
249
-
250
-
251
-
252
-
253
-
254
-
255
-
256
-
257
-
258
-
259
-
260
-
261
-
262
-
263
-
264
-
265
-
266
-
267
-
268
-
269
-
270
-
271
-
272
-
273
-
274
-
275
-
276
-
277
-
278
-
279
-
280
-
281
-
282
-
283
-
284
-
285
-
286
-
287
-
288
-
289
-
290
-
291
-
292
-
293
-
294
-
295
-
296
-
297
-
298
-
299
-
300
-
301
-
302
-
303
-
304
-
305
-
306
-
307
-
308
-
309
-
310
-
311
-
312
-
313
-
314
-
315
-
316
-
317
-
318
-
319
-
320
-
321
-
322
-
323
-
324
-
325
-
326
-
327
-
328
-
329
-
330
-
331
-
332
-
333
-
334
-
335
 |
 |

Table of Contents
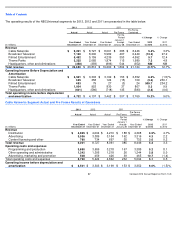
amortization, as defined in the credit facility. As of December 31, 2013, we met this financial covenant by a significant margin. We
do not expect to have to reduce debt or improve operating results in order to continue to comply with this financial covenant.
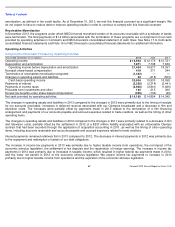
Receivables Monetization
In December 2013, the programs under which NBCUniversal monetized certain of its accounts receivable with a syndicate of banks
were terminated. The final payments of $1.4 billion associated with the termination of these programs are a component of net cash
provided by operating activities in Comcast’s and NBCUniversal’s consolidated statement of cash flows. See Note 17 to Comcast’
s
consolidated financial statements and Note 16 to NBCUniversal’s consolidated financial statements for additional information.
Operating Activities
Components of Net Cash Provided by Operating Activities
The changes in operating assets and liabilities in 2013 compared to the changes in 2012 were primarily due to the timing of receipts
for our accounts receivable, increases in deferred revenue associated with our Olympics broadcasts and a decrease in film and
television costs. The increases were partially offset by payments made in 2013 related to the termination of a film financing
arrangement and payments of our accounts payable and accrued expenses related to trade creditors, as well as the timing of other
operating items.
The changes in operating assets and liabilities in 2012 compared to the changes in 2011 were primarily related to a decrease in film
and television costs, partially offset by the settlement in 2012 of a $237 million liability associated with an unfavorable Olympic
contract that had been recorded through the application of acquisition accounting in 2011, as well as the timing of other operating
items, including accounts receivable and accounts payable and accrued expenses related to trade creditors.
Interest payments remained relatively flat in 2013 compared to 2012. The decrease in interest payments in 2012 was primarily due
to the repayment and redemption of certain of our debt obligations.
The increase in income tax payments in 2013 was primarily due to higher taxable income from operations, the net impact of the
economic stimulus legislation, the settlement of tax disputes and the repatriation of foreign earnings. The increase in income tax
payments in 2012 was primarily due to increases in taxable income, which resulted in higher federal tax payments made in 2012,
and the lower net benefit in 2012 of the economic stimulus legislation. We expect income tax payments to increase in 2014
primarily due to higher taxable income from operations and the expiration of the economic stimulus legislation.
Year ended December 31 (in millions)
2013
2012
2011
Operating income
$
13,563
$
12,179
$
10,721
Depreciation and amortization
7,871
7,798
7,636
Operating income before depreciation and amortization
21,434
19,977
18,357
Noncash share-based compensation
419
371
344
Termination of receivables monetization programs
(1,442
)
—
—
Changes in operating assets and liabilities
93
(418
)
(603
)
Cash basis operating income
20,504
19,930
18,098
Payments of interest
(2,355
)
(2,314
)
(2,441
)
Payments of income taxes
(3,946
)
(2,841
)
(1,626
)
Proceeds from investments and other
162
213
360
Excess tax benefits under share-based compensation
(205
)
(134
)
(46
)
Net cash provided by operating activities
$
14,160
$
14,854
$
14,345
67
Comcast 2013 Annual Report on Form 10
-
K