Comcast 2013 Annual Report Download - page 63
Download and view the complete annual report
Please find page 63 of the 2013 Comcast annual report below. You can navigate through the pages in the report by either clicking on the pages listed below, or by using the keyword search tool below to find specific information within the annual report.-
 1
1 -
2
-
3
-
4
-
5
-
6
-
7
-
8
-
9
-
10
-
11
-
12
-
13
-
14
-
15
-
16
-
17
-
18
-
19
-
20
-
21
-
22
-
23
-
24
-
25
-
26
-
27
-
28
-
29
-
30
-
31
-
32
-
33
-
34
-
35
-
36
-
37
-
38
-
39
-
40
-
41
-
42
-
43
-
44
-
45
-
46
-
47
-
48
-
49
-
50
-
51
-
52
-
 53
53 -
 54
54 -
 55
55 -
 56
56 -
 57
57 -
 58
58 -
 59
59 -
 60
60 -
 61
61 -
 62
62 -
 63
63 -
 64
64 -
 65
65 -
 66
66 -
 67
67 -
 68
68 -
 69
69 -
 70
70 -
 71
71 -
 72
72 -
 73
73 -
74
-
75
-
76
-
77
-
78
-
79
-
80
-
81
-
82
-
83
-
84
-
85
-
86
-
87
-
88
-
89
-
90
-
91
-
92
-
93
-
94
-
95
-
96
-
97
-
98
-
99
-
100
-
101
-
102
-
103
-
104
-
105
-
106
-
107
-
108
-
109
-
110
-
111
-
112
-
113
-
114
-
115
-
116
-
117
-
118
-
119
-
120
-
121
-
122
-
123
-
124
-
125
-
126
-
127
-
128
-
129
-
130
-
131
-
132
-
133
-
134
-
135
-
136
-
137
-
138
-
139
-
140
-
141
-
142
-
143
-
144
-
145
-
146
-
147
-
148
-
149
-
150
-
151
-
152
-
153
-
154
-
155
-
156
-
157
-
158
-
159
-
160
-
161
-
162
-
163
-
164
-
165
-
166
-
167
-
168
-
169
-
170
-
171
-
172
-
173
-
174
-
175
-
176
-
177
-
178
-
179
-
180
-
181
-
182
-
183
-
184
-
185
-
186
-
187
-
188
-
189
-
190
-
191
-
192
-
193
-
194
-
195
-
196
-
197
-
198
-
199
-
200
-
201
-
202
-
203
-
204
-
205
-
206
-
207
-
208
-
209
-
210
-
211
-
212
-
213
-
214
-
215
-
216
-
217
-
218
-
219
-
220
-
221
-
222
-
223
-
224
-
225
-
226
-
227
-
228
-
229
-
230
-
231
-
232
-
233
-
234
-
235
-
236
-
237
-
238
-
239
-
240
-
241
-
242
-
243
-
244
-
245
-
246
-
247
-
248
-
249
-
250
-
251
-
252
-
253
-
254
-
255
-
256
-
257
-
258
-
259
-
260
-
261
-
262
-
263
-
264
-
265
-
266
-
267
-
268
-
269
-
270
-
271
-
272
-
273
-
274
-
275
-
276
-
277
-
278
-
279
-
280
-
281
-
282
-
283
-
284
-
285
-
286
-
287
-
288
-
289
-
290
-
291
-
292
-
293
-
294
-
295
-
296
-
297
-
298
-
299
-
300
-
301
-
302
-
303
-
304
-
305
-
306
-
307
-
308
-
309
-
310
-
311
-
312
-
313
-
314
-
315
-
316
-
317
-
318
-
319
-
320
-
321
-
322
-
323
-
324
-
325
-
326
-
327
-
328
-
329
-
330
-
331
-
332
-
333
-
334
-
335
 |
 |

Table of Contents
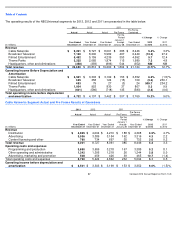
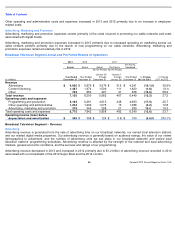
Cable Networks Segment – Revenue
Distribution
Distribution revenue is generated from distribution agreements with multichannel video providers and is affected by the number of
subscribers receiving our cable networks and the fees we charge per subscriber.
Distribution revenue increased in 2013 and 2012 primarily due to increases in the contractual rates that we charged under
distribution agreements.
In 2013, 2012 and 2011, 13% of our Cable Networks segment revenue was generated from our Cable Communications segment.
These amounts are eliminated in Comcast’s consolidated financial statements but are included in the amounts presented above.
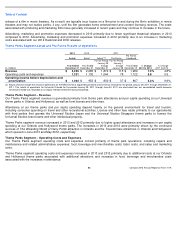
Advertising
Advertising revenue is generated from the sale of advertising time on our cable networks and related digital media properties. Our
advertising revenue is generally based on audience ratings, the value of our viewer demographics to advertisers, and the number
of advertising units we can place in our cable networks’
programming schedules. Advertising revenue is affected by the strength of
the national advertising market, general economic conditions and the success of our programming.
Advertising revenue increased 4.3% and 2.2% in 2013 and 2012, respectively. Higher prices and an increase in the volume of
advertising units sold contributed to increases of 8.9% and 12.9% in 2013 and 2012, respectively. These increases were partially
offset by continued declines in audience ratings at some of our networks.
Content Licensing and Other
We also generate other revenue primarily from the licensing of our owned programming to various distribution platforms, including
cable and broadcast networks, and to digital distributors.
Content licensing and other revenue increased in 2013 primarily due to a new licensing agreement entered into during the year.
Content licensing and other revenue remained flat in 2012.
Cable Networks Segment – Operating Costs and Expenses
Programming and Production
Programming and production costs include the amortization of owned and acquired programming, sports rights, direct production
costs, residual and participation payments, production overhead, costs associated with the distribution of our programming to third-
party networks and other distribution platforms, and on-air talent costs.
Programming and production costs increased in 2013 and 2012 primarily due to our continued investment in original programming
at certain of our cable networks and higher sports programming costs. The increase in sports programming costs in 2013 included
the impact from an increase in the number of NHL games compared to 2012 due to the NHL lockout in 2012 as well as costs
associated with our broadcasts of the English Premier League soccer. The increase in sports programming costs in 2012 included
the impact from an increase in the number of NBA games compared to 2011 due to the NBA lockout in 2011.
Other Operating and Administrative
Other operating and administrative costs and expenses include salaries, employee benefits, rent and other overhead expenses.
Comcast 2013 Annual Report on Form 10-K
58