Comcast 2013 Annual Report Download - page 69
Download and view the complete annual report
Please find page 69 of the 2013 Comcast annual report below. You can navigate through the pages in the report by either clicking on the pages listed below, or by using the keyword search tool below to find specific information within the annual report.-
 1
1 -
2
-
3
-
4
-
5
-
6
-
7
-
8
-
9
-
10
-
11
-
12
-
13
-
14
-
15
-
16
-
17
-
18
-
19
-
20
-
21
-
22
-
23
-
24
-
25
-
26
-
27
-
28
-
29
-
30
-
31
-
32
-
33
-
34
-
35
-
36
-
37
-
38
-
39
-
40
-
41
-
42
-
43
-
44
-
45
-
46
-
47
-
48
-
49
-
50
-
51
-
52
-
53
-
54
-
55
-
56
-
57
-
58
-
 59
59 -
 60
60 -
 61
61 -
 62
62 -
 63
63 -
 64
64 -
 65
65 -
 66
66 -
 67
67 -
 68
68 -
 69
69 -
 70
70 -
 71
71 -
 72
72 -
 73
73 -
 74
74 -
 75
75 -
 76
76 -
 77
77 -
 78
78 -
 79
79 -
80
-
81
-
82
-
83
-
84
-
85
-
86
-
87
-
88
-
89
-
90
-
91
-
92
-
93
-
94
-
95
-
96
-
97
-
98
-
99
-
100
-
101
-
102
-
103
-
104
-
105
-
106
-
107
-
108
-
109
-
110
-
111
-
112
-
113
-
114
-
115
-
116
-
117
-
118
-
119
-
120
-
121
-
122
-
123
-
124
-
125
-
126
-
127
-
128
-
129
-
130
-
131
-
132
-
133
-
134
-
135
-
136
-
137
-
138
-
139
-
140
-
141
-
142
-
143
-
144
-
145
-
146
-
147
-
148
-
149
-
150
-
151
-
152
-
153
-
154
-
155
-
156
-
157
-
158
-
159
-
160
-
161
-
162
-
163
-
164
-
165
-
166
-
167
-
168
-
169
-
170
-
171
-
172
-
173
-
174
-
175
-
176
-
177
-
178
-
179
-
180
-
181
-
182
-
183
-
184
-
185
-
186
-
187
-
188
-
189
-
190
-
191
-
192
-
193
-
194
-
195
-
196
-
197
-
198
-
199
-
200
-
201
-
202
-
203
-
204
-
205
-
206
-
207
-
208
-
209
-
210
-
211
-
212
-
213
-
214
-
215
-
216
-
217
-
218
-
219
-
220
-
221
-
222
-
223
-
224
-
225
-
226
-
227
-
228
-
229
-
230
-
231
-
232
-
233
-
234
-
235
-
236
-
237
-
238
-
239
-
240
-
241
-
242
-
243
-
244
-
245
-
246
-
247
-
248
-
249
-
250
-
251
-
252
-
253
-
254
-
255
-
256
-
257
-
258
-
259
-
260
-
261
-
262
-
263
-
264
-
265
-
266
-
267
-
268
-
269
-
270
-
271
-
272
-
273
-
274
-
275
-
276
-
277
-
278
-
279
-
280
-
281
-
282
-
283
-
284
-
285
-
286
-
287
-
288
-
289
-
290
-
291
-
292
-
293
-
294
-
295
-
296
-
297
-
298
-
299
-
300
-
301
-
302
-
303
-
304
-
305
-
306
-
307
-
308
-
309
-
310
-
311
-
312
-
313
-
314
-
315
-
316
-
317
-
318
-
319
-
320
-
321
-
322
-
323
-
324
-
325
-
326
-
327
-
328
-
329
-
330
-
331
-
332
-
333
-
334
-
335
 |
 |

Table of Contents
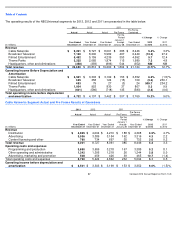
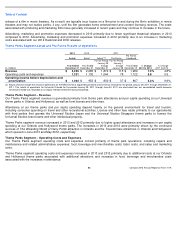
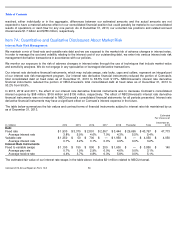
NBCUniversal Headquarters, Other and Eliminations
Headquarters and Other operating costs and expenses incurred by our NBCUniversal businesses include overhead, personnel
costs and costs associated with corporate initiatives. Operating costs and expenses increased in 2013 primarily due to higher
employee costs. Operating costs and expenses remained flat in 2012 primarily due to higher technology and administrative costs
offset by the impact of transaction-
related costs associated with the 2011 NBCUniversal transaction, including severance and other
compensation-related costs.
Eliminations include the results of operations for Universal Orlando for the period January 29, 2011 through June 30, 2011. Our
Theme Parks segment included the results of operations of Universal Orlando for this period because these amounts had been
reflected in our segment performance measure. These amounts were not included when we measured total NBCUniversal and our
consolidated results of operations because we recorded Universal Orlando as an equity method investment for the period
January 29, 2011 through June 30, 2011.
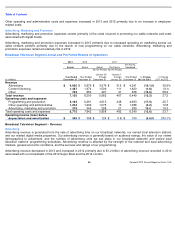
Corporate and Other Results of Operations
Corporate and Other – Revenue
Other revenue primarily relates to Comcast-
Spectacor, which owns the Philadelphia Flyers and the Wells Fargo Center arena in
Philadelphia and operates arena management-related businesses.
Other revenue increased in 2013 primarily due to an increase in the number of NHL games compared to 2012 due to the lockout in
2012. Other revenue decreased in 2012 primarily due to a loss in revenue associated with the NHL lockout.
Corporate and Other – Operating Costs and Expenses
Corporate and Other operating costs and expenses primarily include overhead, personnel costs, the cost of corporate initiatives
incurred by our Comcast businesses and operating costs and expenses associated with Comcast-Spectacor.
Corporate and Other operating costs and expenses increased in 2013 primarily due to $74 million of expenses associated with the
final settlement of the terminated qualified pension plan that provided benefits to former employees of a company we acquired as
part of the AT&T Broadband transaction in 2002 as well as an increase in labor costs in our Comcast-
Spectacor business.
Corporate and Other operating costs and expenses decreased in 2012 primarily due to the NHL lockout.
Year ended December 31 (in millions)
2013
2012
2011
% Change
2012 to 2013
% Change
2011 to 2012
Revenue
$
600
$
498
$
558
20.6
%
(10.8
)%
Operating costs and expenses
1,089
874
974
24.7
(10.3
)
Operating income (loss) before depreciation and amortization
$
(489
)
$
(376
)
$
(416
)
(30.2
)%
9.7
%
Comcast 2013 Annual Report on Form 10-K
64