Comcast 2013 Annual Report Download - page 59
Download and view the complete annual report
Please find page 59 of the 2013 Comcast annual report below. You can navigate through the pages in the report by either clicking on the pages listed below, or by using the keyword search tool below to find specific information within the annual report.-
 1
1 -
2
-
3
-
4
-
5
-
6
-
7
-
8
-
9
-
10
-
11
-
12
-
13
-
14
-
15
-
16
-
17
-
18
-
19
-
20
-
21
-
22
-
23
-
24
-
25
-
26
-
27
-
28
-
29
-
30
-
31
-
32
-
33
-
34
-
35
-
36
-
37
-
38
-
39
-
40
-
41
-
42
-
43
-
44
-
45
-
46
-
47
-
48
-
 49
49 -
 50
50 -
 51
51 -
 52
52 -
 53
53 -
 54
54 -
 55
55 -
 56
56 -
 57
57 -
 58
58 -
 59
59 -
 60
60 -
 61
61 -
 62
62 -
 63
63 -
 64
64 -
 65
65 -
 66
66 -
 67
67 -
 68
68 -
 69
69 -
70
-
71
-
72
-
73
-
74
-
75
-
76
-
77
-
78
-
79
-
80
-
81
-
82
-
83
-
84
-
85
-
86
-
87
-
88
-
89
-
90
-
91
-
92
-
93
-
94
-
95
-
96
-
97
-
98
-
99
-
100
-
101
-
102
-
103
-
104
-
105
-
106
-
107
-
108
-
109
-
110
-
111
-
112
-
113
-
114
-
115
-
116
-
117
-
118
-
119
-
120
-
121
-
122
-
123
-
124
-
125
-
126
-
127
-
128
-
129
-
130
-
131
-
132
-
133
-
134
-
135
-
136
-
137
-
138
-
139
-
140
-
141
-
142
-
143
-
144
-
145
-
146
-
147
-
148
-
149
-
150
-
151
-
152
-
153
-
154
-
155
-
156
-
157
-
158
-
159
-
160
-
161
-
162
-
163
-
164
-
165
-
166
-
167
-
168
-
169
-
170
-
171
-
172
-
173
-
174
-
175
-
176
-
177
-
178
-
179
-
180
-
181
-
182
-
183
-
184
-
185
-
186
-
187
-
188
-
189
-
190
-
191
-
192
-
193
-
194
-
195
-
196
-
197
-
198
-
199
-
200
-
201
-
202
-
203
-
204
-
205
-
206
-
207
-
208
-
209
-
210
-
211
-
212
-
213
-
214
-
215
-
216
-
217
-
218
-
219
-
220
-
221
-
222
-
223
-
224
-
225
-
226
-
227
-
228
-
229
-
230
-
231
-
232
-
233
-
234
-
235
-
236
-
237
-
238
-
239
-
240
-
241
-
242
-
243
-
244
-
245
-
246
-
247
-
248
-
249
-
250
-
251
-
252
-
253
-
254
-
255
-
256
-
257
-
258
-
259
-
260
-
261
-
262
-
263
-
264
-
265
-
266
-
267
-
268
-
269
-
270
-
271
-
272
-
273
-
274
-
275
-
276
-
277
-
278
-
279
-
280
-
281
-
282
-
283
-
284
-
285
-
286
-
287
-
288
-
289
-
290
-
291
-
292
-
293
-
294
-
295
-
296
-
297
-
298
-
299
-
300
-
301
-
302
-
303
-
304
-
305
-
306
-
307
-
308
-
309
-
310
-
311
-
312
-
313
-
314
-
315
-
316
-
317
-
318
-
319
-
320
-
321
-
322
-
323
-
324
-
325
-
326
-
327
-
328
-
329
-
330
-
331
-
332
-
333
-
334
-
335
 |
 |

Table of Contents
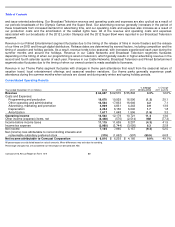
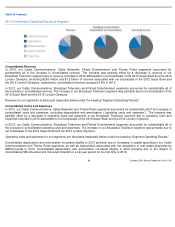
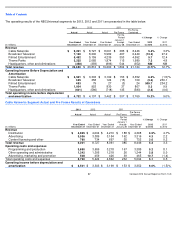
As of December 31, 2013, 40% of the homes and businesses in the areas we serve subscribed to our video services, compared to
41% and 43% as of December 31, 2012 and 2011, respectively.
High-Speed Internet
High-
speed Internet revenue increased 8.3% and 9.2% in 2013 and 2012, respectively. Increases in the number of residential
customers accounted for increases in revenue of approximately 6% in both years. The remaining increases in revenue in 2013 and
2012 were primarily due to higher rates from customers receiving higher levels of service and rate adjustments.
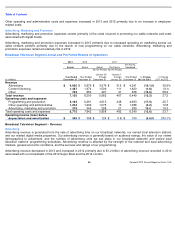
As of December 31, 2013, 38% of the homes and businesses in the areas we serve subscribed to our high-
speed Internet services,
compared to 36% and 35% as of December 31, 2012 and 2011, respectively. Our customer base continues to grow as consumers
continue to choose our high-speed Internet service and seek higher speed offerings.
Voice
Voice revenue increased 2.8% and 1.5% in 2013 and 2012, respectively. Increases in the number of residential customers
receiving our services through our discounted bundled offerings accounted for increases in revenue of approximately 6% and 4% in
2013 and 2012, respectively. These increases were partially offset in both years by the impact of the allocation of voice revenue for
our bundled customers because revenue attributable to voice services represents a lower proportion of the bundled rate. The
amounts allocated to voice revenue in the bundled rate have decreased in 2013 and 2012 because video and high-
speed Internet
rates have increased, while voice rates have remained relatively flat.
As of December 31, 2013, 20% of the homes and businesses in the areas we serve subscribed to our voice services, compared to
19% and 18% as of December 31, 2012 and 2011, respectively.
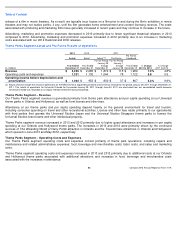
Business Services
Business services revenue increased 26.4% and 31.3% in 2013 and 2012, respectively. The increases in both years were primarily
due to a higher number of business customers receiving our cable services. The remaining increases in both years were primarily
due to continued growth in the number of medium-
sized business customers, including those receiving our Ethernet network and
cellular backhaul services. In 2013, our medium-
sized business customers represented 19% of total business services revenue,
compared to 15% and 12% in 2012 and 2011, respectively. We believe these increases in business customers are primarily the
result of our efforts to gain market share from competitors by offering competitive products and pricing.
Advertising
As part of our distribution agreements with cable networks, we generally receive an allocation of scheduled advertising time on
cable networks that we sell to local, regional and national advertisers under the Spotlight brand. In most cases, the available
advertising time is sold by our sales force. In some cases, we work with representation firms as an extension of our sales force to
sell a portion of the advertising time allocated to us. We also represent the advertising sales of other multichannel video providers in
some markets. In addition, we generate revenue from the sale of advertising online and on our On Demand service.
Advertising revenue is affected by the strength of the advertising market and general economic conditions. Advertising revenue
decreased 4.2% in 2013 primarily due to lower political advertising revenue. Excluding the impact of political advertising revenue in
2012, advertising revenue increased 4.8% primarily due to increases in the national and regional advertising markets. Advertising
revenue increased 14.1% in 2012 primarily due to increases in political advertising revenue and improvements in the local and
regional advertising markets, which were primarily driven by increased spending from automotive advertisers.
Comcast 2013 Annual Report on Form 10
-
K
54