Comcast 2013 Annual Report Download - page 156
Download and view the complete annual report
Please find page 156 of the 2013 Comcast annual report below. You can navigate through the pages in the report by either clicking on the pages listed below, or by using the keyword search tool below to find specific information within the annual report.-
 1
1 -
2
-
3
-
4
-
5
-
6
-
7
-
8
-
9
-
10
-
11
-
12
-
13
-
14
-
15
-
16
-
17
-
18
-
19
-
20
-
21
-
22
-
23
-
24
-
25
-
26
-
27
-
28
-
29
-
30
-
31
-
32
-
33
-
34
-
35
-
36
-
37
-
38
-
39
-
40
-
41
-
42
-
43
-
44
-
45
-
46
-
47
-
48
-
49
-
50
-
51
-
52
-
53
-
54
-
55
-
56
-
57
-
58
-
59
-
60
-
61
-
62
-
63
-
64
-
65
-
66
-
67
-
68
-
69
-
70
-
71
-
72
-
73
-
74
-
75
-
76
-
77
-
78
-
79
-
80
-
81
-
82
-
83
-
84
-
85
-
86
-
87
-
88
-
89
-
90
-
91
-
92
-
93
-
94
-
95
-
96
-
97
-
98
-
99
-
100
-
101
-
102
-
103
-
104
-
105
-
106
-
107
-
108
-
109
-
110
-
111
-
112
-
113
-
114
-
115
-
116
-
117
-
118
-
119
-
120
-
121
-
122
-
123
-
124
-
125
-
126
-
127
-
128
-
129
-
130
-
131
-
132
-
133
-
134
-
135
-
136
-
137
-
138
-
139
-
140
-
141
-
142
-
143
-
144
-
145
-
 146
146 -
 147
147 -
 148
148 -
 149
149 -
 150
150 -
 151
151 -
 152
152 -
 153
153 -
 154
154 -
 155
155 -
 156
156 -
 157
157 -
 158
158 -
 159
159 -
 160
160 -
 161
161 -
 162
162 -
 163
163 -
 164
164 -
 165
165 -
 166
166 -
167
-
168
-
169
-
170
-
171
-
172
-
173
-
174
-
175
-
176
-
177
-
178
-
179
-
180
-
181
-
182
-
183
-
184
-
185
-
186
-
187
-
188
-
189
-
190
-
191
-
192
-
193
-
194
-
195
-
196
-
197
-
198
-
199
-
200
-
201
-
202
-
203
-
204
-
205
-
206
-
207
-
208
-
209
-
210
-
211
-
212
-
213
-
214
-
215
-
216
-
217
-
218
-
219
-
220
-
221
-
222
-
223
-
224
-
225
-
226
-
227
-
228
-
229
-
230
-
231
-
232
-
233
-
234
-
235
-
236
-
237
-
238
-
239
-
240
-
241
-
242
-
243
-
244
-
245
-
246
-
247
-
248
-
249
-
250
-
251
-
252
-
253
-
254
-
255
-
256
-
257
-
258
-
259
-
260
-
261
-
262
-
263
-
264
-
265
-
266
-
267
-
268
-
269
-
270
-
271
-
272
-
273
-
274
-
275
-
276
-
277
-
278
-
279
-
280
-
281
-
282
-
283
-
284
-
285
-
286
-
287
-
288
-
289
-
290
-
291
-
292
-
293
-
294
-
295
-
296
-
297
-
298
-
299
-
300
-
301
-
302
-
303
-
304
-
305
-
306
-
307
-
308
-
309
-
310
-
311
-
312
-
313
-
314
-
315
-
316
-
317
-
318
-
319
-
320
-
321
-
322
-
323
-
324
-
325
-
326
-
327
-
328
-
329
-
330
-
331
-
332
-
333
-
334
-
335
 |
 |

Table of Contents
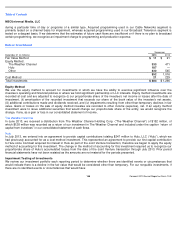
NBCUniversal Media, LLC
Consolidated Statements of Changes in Equity
See accompanying notes to consolidated financial statements.
Predecessor
(in millions)
Common
Stock
Additional
Paid
-
In Capital
Retained
Earnings
Accumulated Other
Comprehensive
Income (Loss)
Non-
controlling
Interests
Total
Equity
Balance, January 1, 2011
$
—
$
23,592
$
320
$
(13
)
$
(82
)
$
23,817
Compensation plans
48
48
Dividends declared
(7,846
)
(297
)
(8,143
)
Other
(331
)
2
(329
)
Other comprehensive income (loss)
3
3
Net income (loss)
(23
)
(2
)
(25
)
Balance, January 28, 2011
$
—
$
15,463
$
—
$ (
10
)
$
(82
)
$
15,371
Successor
(in millions)
Redeemable
Noncontrolling
Interests
Member’s
Capital
Accumulated
Other
Comprehensive
Income (Loss)
Non
-
controlling
Interests
Total
Equity
Member’s equity, remeasured at January 28, 2011
$
—
$
24,089
$ —
$
262
$
24,351
Contribution of Comcast Content Business
136
4,344
—
57
4,401
Total member
’
s equity at January 28, 2011
136
28,433
—
319
28,752
Compensation plans
17
17
Dividends declared
(244
)
(244
)
Issuance of subsidiary shares to noncontrolling interests
40
89
43
132
Contributions from (distributions to) noncontrolling interests, net
(8
)
(176
)
(176
)
Other
(180
)
13
(167
)
Other comprehensive income (loss)
(78
)
(78
)
Net income (loss)
16
1,683
162
1,845
Balance, December 31, 2011
184
29,798
(78
)
361
30,081
Compensation plans
7
7
Dividends declared
(964
)
(964
)
Purchase of subsidiary shares from noncontrolling interests
(47
)
Contributions from (distributions to) noncontrolling interests, net
(24
)
(184
)
(184
)
Other
4
84
88
Other comprehensive income (loss)
13
13
Net income (loss)
18
3,055
158
3,213
Balance, December 31, 2012
131
31,900
(65
)
419
32,254
Compensation plans
7
7
Redemption Transaction distribution
(3,200
)
(3,200
)
Dividends declared
(1,422
)
(1,422
)
Contributions from (distributions to) noncontrolling interests,
net
(22
)
(155
)
(155
)
Purchase of subsidiary shares from noncontrolling interests
(33
)
(33
)
Other
102
(164
)
(111
)
(275
)
Other comprehensive income (loss)
49
49
Net income (loss)
20
1,968
134
2,102
Balance, December 31, 2013
$
231
$
29,056
$
(16
)
$
287
$
29,327
151
Comcast 2013 Annual Report on Form 10
-
K