Comcast 2013 Annual Report Download - page 66
Download and view the complete annual report
Please find page 66 of the 2013 Comcast annual report below. You can navigate through the pages in the report by either clicking on the pages listed below, or by using the keyword search tool below to find specific information within the annual report.-
 1
1 -
2
-
3
-
4
-
5
-
6
-
7
-
8
-
9
-
10
-
11
-
12
-
13
-
14
-
15
-
16
-
17
-
18
-
19
-
20
-
21
-
22
-
23
-
24
-
25
-
26
-
27
-
28
-
29
-
30
-
31
-
32
-
33
-
34
-
35
-
36
-
37
-
38
-
39
-
40
-
41
-
42
-
43
-
44
-
45
-
46
-
47
-
48
-
49
-
50
-
51
-
52
-
53
-
54
-
55
-
 56
56 -
 57
57 -
 58
58 -
 59
59 -
 60
60 -
 61
61 -
 62
62 -
 63
63 -
 64
64 -
 65
65 -
 66
66 -
 67
67 -
 68
68 -
 69
69 -
 70
70 -
 71
71 -
 72
72 -
 73
73 -
 74
74 -
 75
75 -
 76
76 -
77
-
78
-
79
-
80
-
81
-
82
-
83
-
84
-
85
-
86
-
87
-
88
-
89
-
90
-
91
-
92
-
93
-
94
-
95
-
96
-
97
-
98
-
99
-
100
-
101
-
102
-
103
-
104
-
105
-
106
-
107
-
108
-
109
-
110
-
111
-
112
-
113
-
114
-
115
-
116
-
117
-
118
-
119
-
120
-
121
-
122
-
123
-
124
-
125
-
126
-
127
-
128
-
129
-
130
-
131
-
132
-
133
-
134
-
135
-
136
-
137
-
138
-
139
-
140
-
141
-
142
-
143
-
144
-
145
-
146
-
147
-
148
-
149
-
150
-
151
-
152
-
153
-
154
-
155
-
156
-
157
-
158
-
159
-
160
-
161
-
162
-
163
-
164
-
165
-
166
-
167
-
168
-
169
-
170
-
171
-
172
-
173
-
174
-
175
-
176
-
177
-
178
-
179
-
180
-
181
-
182
-
183
-
184
-
185
-
186
-
187
-
188
-
189
-
190
-
191
-
192
-
193
-
194
-
195
-
196
-
197
-
198
-
199
-
200
-
201
-
202
-
203
-
204
-
205
-
206
-
207
-
208
-
209
-
210
-
211
-
212
-
213
-
214
-
215
-
216
-
217
-
218
-
219
-
220
-
221
-
222
-
223
-
224
-
225
-
226
-
227
-
228
-
229
-
230
-
231
-
232
-
233
-
234
-
235
-
236
-
237
-
238
-
239
-
240
-
241
-
242
-
243
-
244
-
245
-
246
-
247
-
248
-
249
-
250
-
251
-
252
-
253
-
254
-
255
-
256
-
257
-
258
-
259
-
260
-
261
-
262
-
263
-
264
-
265
-
266
-
267
-
268
-
269
-
270
-
271
-
272
-
273
-
274
-
275
-
276
-
277
-
278
-
279
-
280
-
281
-
282
-
283
-
284
-
285
-
286
-
287
-
288
-
289
-
290
-
291
-
292
-
293
-
294
-
295
-
296
-
297
-
298
-
299
-
300
-
301
-
302
-
303
-
304
-
305
-
306
-
307
-
308
-
309
-
310
-
311
-
312
-
313
-
314
-
315
-
316
-
317
-
318
-
319
-
320
-
321
-
322
-
323
-
324
-
325
-
326
-
327
-
328
-
329
-
330
-
331
-
332
-
333
-
334
-
335
 |
 |

Table of Contents
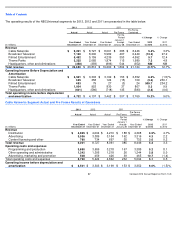
Advertising, marketing and promotion expenses increased in 2013 and 2012 primarily due to increased spending on marketing
associated with our primetime schedule.
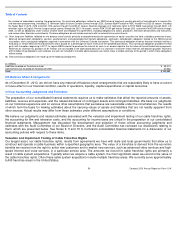
Filmed Entertainment Segment Actual and Pro Forma Results of Operations
Filmed Entertainment Segment – Revenue
Theatrical
Theatrical revenue is generated from the worldwide theatrical release of our owned and acquired films for exhibition in movie
theaters and is significantly affected by the timing of each release and the number of films we distribute, as well as their acceptance
by consumers. Theatrical revenue is also affected by the number of exhibition screens, ticket prices, the percentage of ticket sale
retention by the exhibitors and the popularity of competing films at the time our films are released. The success of a film in movie
theaters is a significant factor in determining the revenue a film is likely to generate in succeeding distribution platforms.
Theatrical revenue increased in 2013 primarily due to the strong performance of Despicable Me 2 and Fast and Furious 6
.
Theatrical revenue increased in 2012 primarily due to the strong performance of Ted , Dr. Seuss’ The Lorax and
The Bourne
Legacy .
Content Licensing
Content licensing revenue is generated primarily from the licensing of our owned and acquired films to cable, broadcast and
premium networks, as well as to digital distributors.
Content licensing revenue increased in 2013 primarily due to the international licensing of our 2012 theatrical releases as well as
from the licensing of our current year theatrical releases to digital distributors. Content
2013
2012
2011
Actual
Actual
Actual
Pro Forma
Pro Forma
Combined
(in millions)
Year Ended
December 31
Year Ended
December 31
For the Period
January 29
through
December 31
For the Period
January 1
through
January 28
Year Ended
December 31
% Change
2012 to 2013
% Change
2011 to 2012
Revenue
Theatrical
$
1,568
$
1,390
$
983
$
58
$
1,041
12.8
%
33.5
%
Content licensing
1,654
1,540
1,234
171
1,405
7.4
9.7
Home entertainment
1,828
1,834
1,559
96
1,655
(0.3
)
10.8
Other
402
395
463
28
491
1.8
(19.6
)
Total revenue
5,452
5,159
4,239
353
4,592
5.7
12.4
Operating costs and expenses
Programming and production
2,982
3,002
2,266
205
2,471
(0.7
)
21.5
Other operating and administrative
716
652
768
55
823
9.8
(20.6
)
Advertising, marketing and promotion
1,271
1,426
1,178
96
1,274
(10.8
)
11.9
Total operating costs and expenses
4,969
5,080
4,212
356
4,568
(2.2
)
11.2
Operating income (loss) before
depreciation and amortization
$
483
$
79
$
27
$
(3
)
$
24
509.7
%
234.2
%
61
Comcast 2013 Annual Report on Form 10
-
K