Comcast 2013 Annual Report Download - page 58
Download and view the complete annual report
Please find page 58 of the 2013 Comcast annual report below. You can navigate through the pages in the report by either clicking on the pages listed below, or by using the keyword search tool below to find specific information within the annual report.-
 1
1 -
2
-
3
-
4
-
5
-
6
-
7
-
8
-
9
-
10
-
11
-
12
-
13
-
14
-
15
-
16
-
17
-
18
-
19
-
20
-
21
-
22
-
23
-
24
-
25
-
26
-
27
-
28
-
29
-
30
-
31
-
32
-
33
-
34
-
35
-
36
-
37
-
38
-
39
-
40
-
41
-
42
-
43
-
44
-
45
-
46
-
47
-
 48
48 -
 49
49 -
 50
50 -
 51
51 -
 52
52 -
 53
53 -
 54
54 -
 55
55 -
 56
56 -
 57
57 -
 58
58 -
 59
59 -
 60
60 -
 61
61 -
 62
62 -
 63
63 -
 64
64 -
 65
65 -
 66
66 -
 67
67 -
 68
68 -
69
-
70
-
71
-
72
-
73
-
74
-
75
-
76
-
77
-
78
-
79
-
80
-
81
-
82
-
83
-
84
-
85
-
86
-
87
-
88
-
89
-
90
-
91
-
92
-
93
-
94
-
95
-
96
-
97
-
98
-
99
-
100
-
101
-
102
-
103
-
104
-
105
-
106
-
107
-
108
-
109
-
110
-
111
-
112
-
113
-
114
-
115
-
116
-
117
-
118
-
119
-
120
-
121
-
122
-
123
-
124
-
125
-
126
-
127
-
128
-
129
-
130
-
131
-
132
-
133
-
134
-
135
-
136
-
137
-
138
-
139
-
140
-
141
-
142
-
143
-
144
-
145
-
146
-
147
-
148
-
149
-
150
-
151
-
152
-
153
-
154
-
155
-
156
-
157
-
158
-
159
-
160
-
161
-
162
-
163
-
164
-
165
-
166
-
167
-
168
-
169
-
170
-
171
-
172
-
173
-
174
-
175
-
176
-
177
-
178
-
179
-
180
-
181
-
182
-
183
-
184
-
185
-
186
-
187
-
188
-
189
-
190
-
191
-
192
-
193
-
194
-
195
-
196
-
197
-
198
-
199
-
200
-
201
-
202
-
203
-
204
-
205
-
206
-
207
-
208
-
209
-
210
-
211
-
212
-
213
-
214
-
215
-
216
-
217
-
218
-
219
-
220
-
221
-
222
-
223
-
224
-
225
-
226
-
227
-
228
-
229
-
230
-
231
-
232
-
233
-
234
-
235
-
236
-
237
-
238
-
239
-
240
-
241
-
242
-
243
-
244
-
245
-
246
-
247
-
248
-
249
-
250
-
251
-
252
-
253
-
254
-
255
-
256
-
257
-
258
-
259
-
260
-
261
-
262
-
263
-
264
-
265
-
266
-
267
-
268
-
269
-
270
-
271
-
272
-
273
-
274
-
275
-
276
-
277
-
278
-
279
-
280
-
281
-
282
-
283
-
284
-
285
-
286
-
287
-
288
-
289
-
290
-
291
-
292
-
293
-
294
-
295
-
296
-
297
-
298
-
299
-
300
-
301
-
302
-
303
-
304
-
305
-
306
-
307
-
308
-
309
-
310
-
311
-
312
-
313
-
314
-
315
-
316
-
317
-
318
-
319
-
320
-
321
-
322
-
323
-
324
-
325
-
326
-
327
-
328
-
329
-
330
-
331
-
332
-
333
-
334
-
335
 |
 |

Table of Contents
Customer Metrics
Customer data includes residential and business customers.
Cable Communications Segment – Revenue
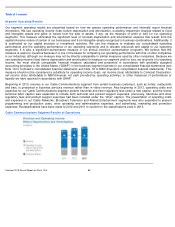
Our Cable Communications segment leverages our existing cable distribution system to grow revenue by, among other things,
adding new customers, encouraging existing cable customers to add new or higher tier services, and growing other services such
as our business services offerings and our home security and automation services. We offer our cable services in bundles and
often provide promotional incentives. We seek to balance promotional offers and rate increases with their expected effects on the
number of customers and overall revenue.
Video
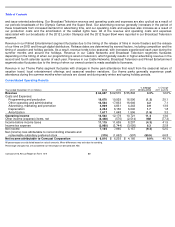
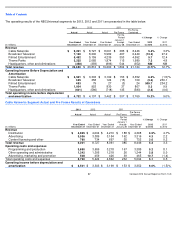
Video revenue increased 2.9% and 2.5% in 2013 and 2012, respectively. Increases in revenue of approximately 5% in both years
were primarily related to customers receiving additional and higher levels of video service, as well as from rate adjustments. As of
December 31, 2013, 12.4 million customers subscribed to at least one of our HDTV or DVR advanced services compared to
11.8 million customers and 10.9 million customers as of December 31, 2012 and 2011, respectively. In both years, the increases in
revenue were partially offset by fewer residential video customers. These decreases were primarily due to competitive pressures in
our service areas from phone and satellite competitors and the impact of rate adjustments. We may experience further declines in
the number of residential video customers.
Year ended December 31 (in millions)
2013
2012
2011
% Change from
2012 to 2013
% Change from
2011 to 2012
Revenue
Residential:
Video
$
20,535
$
19,952
$
19,464
2.9
%
2.5
%
High-speed Internet
10,334
9,544
8,743
8.3
9.2
Voice
3,657
3,557
3,503
2.8
1.5
Business services
3,241
2,565
1,953
26.4
31.3
Advertising
2,189
2,284
2,001
(4.2
)
14.1
Other
1,880
1,702
1,562
10.5
9.0
Total revenue
41,836
39,604
37,226
5.6
6.4
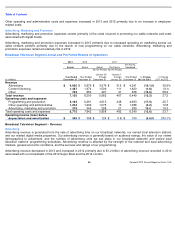
Operating costs and expenses
Programming
9,107
8,386
7,851
8.6
6.8
Technical and product support
5,349
5,187
5,048
3.1
2.7
Customer service
2,097
1,995
1,911
5.1
4.4
Franchise and other regulatory fees
1,246
1,176
1,104
6.0
6.5
Advertising, marketing and promotion
2,896
2,731
2,430
6.0
12.4
Other
3,936
3,874
3,594
1.6
7.8
Total operating costs and expenses
24,631
23,349
21,938
5.5
6.4
Operating income before depreciation and amortization
$
17,205
$
16,255
$
15,288
5.8
%
6.3
%
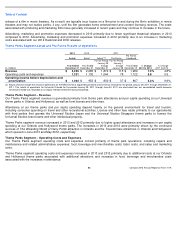
Total Customers
Net Additional Customers
December 31 (in thousands)
2013
2012
2011
2013
2012
2011
Video customers
21,690
21,995
22,331
(305
)
(336
)
(459
)
High-speed Internet customers
20,662
19,367
18,144
1,296
1,223
1,159
Voice customers
10,723
9,955
9,342
768
613
732
53
Comcast 2013 Annual Report on Form 10-
K